Figures & data
Figure 1 Characterization of oncolytic adenovirus ZD55-TRAIL. (A) The diagram of adenovirus. WT, wild type. ITR, inverted terminal repeats. (B) Identification of recombinant adenovirus by western blot analysis. ZD55-TRAIL (8MOI), DOX (0.2 μmol/L), or ZD55-TRAIL (8MOI) plus DOX (0.2 μmol/L) were used to treat Hep2 cells for 48 hrs. Collected cell proteins for analyzing the expression of E1A and TRAIL. Untreated cells served as control. GAPDH was used as a protein loading control. (C) Hep2 cells were treated as (B). The progeny virus was collected for virus titer determination. (D) E4 gene copies were determined as a measurement of viral replication. Data are presented in (C, D) as mean ± SD of three independent experiments. *p<0.05, **p<0.01.
Abbreviations: DOX, doxorubicin; TRAIL, tumor necrosis factor-related apoptosis-inducing ligand.
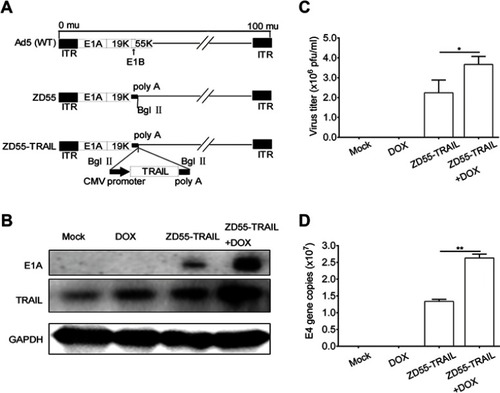
Figure 2 The combination of ZD55-TRAIL and DOX suppressed tumor cell proliferation. (A) Hep2 cells were treated with ZD55-TRAIL, DOX, or ZD55-TRAIL plus DOX for 48 hrs with the indicated dosage. Cell viability was evaluated by the MTT assay. (B) Synergistic effect of ZD55-TRAIL combined with DOX was quantified by combination index (CI) analysis and expressed as log (CI) versus fraction affected. 95% confidence intervals are shown. (C) Hep2 cells were subjected to crystal violet staining for cell viability determination 48 hrs after treatment. (D) Representative fluorescence microscope images of EGFP expression in Hep2 and L-02 cells after 10MOI ZD55-EGFP infection. (E) The percentage of EGFP-positive cells was measured by flow cytometry. (F) L-02 cells were treated with ZD55-TRAIL, DOX, or ZD55-TRAIL plus DOX for 48 hrs with the indicated dosage. Cell viability was determined by the MTT assay. (G) Expression of TRAIL mRNA was detected in Hep2 and L-02 cells using qRT-PCR at the indicated time points after 10MOI ZD55-TRAIL infection. Data are presented in (A, E, F, G) as mean ± SD of three independent experiments. **p<0.01, NS, nonsignificant.
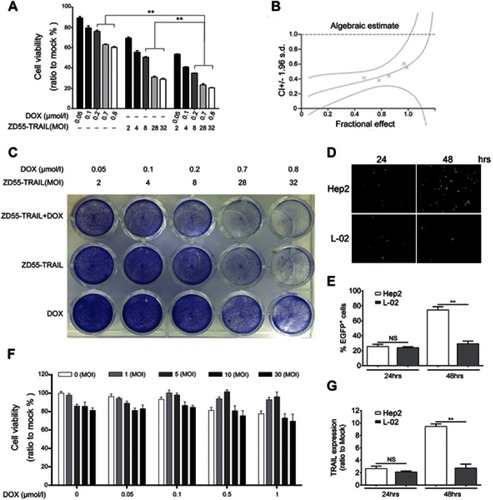
Figure 3 DOX enhanced ZD55-TRAIL-induced apoptosis in Hep2 cells. (A) Hep2 cells were infected with ZD55-TRAIL (8MOI), DOX (0.2 μmol/L), or ZD55-TRAIL (8MOI) plus DOX (0.2 μmol/l). 48 hrs later, Hep2 cells were stained with Hoechst 33342. The white arrows indicated apoptotic cells. Original magnification, 200×. (B) 48 hrs after treatment, the apoptosis of Hep2 cells was measured by flow cytometry. **p<0.01. (C) Activation of caspase-mediated apoptosis signaling pathway. Cells were treated as mentioned in (A) for 48 hrs. The expression of the indicated proteins was detected by western blot. GAPDH was used as a loading control.
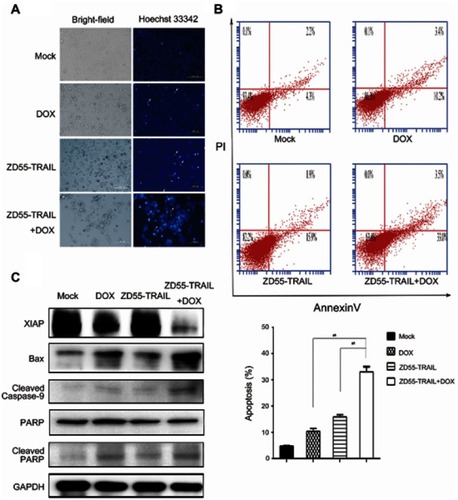
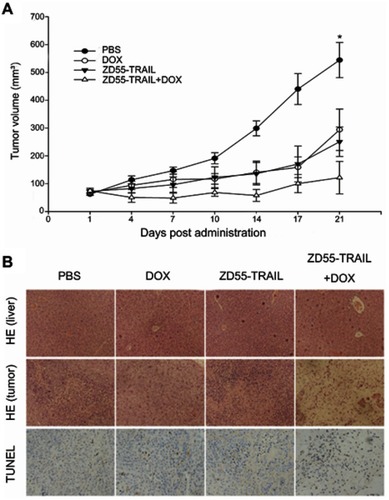
Figure 4 Antitumor effect of DOX and ZD55-TRAIL in Hep2 xenografts. Mice were treated with an intratumoral injection of PBS, DOX, ZD55-TRAIL, or ZD55-TRAIL followed by DOX. (A) Tumor volume was measured. *p<0.05. (B) Subcutaneous Hep2 tumors and liver tissues were performed for HE staining analysis (the upper two rows, original magnifcation: 100×). The lower row showed the cell apoptosis in tumor tissues by TUNEL assay (original magnification: 200×).