Figures & data
Figure 13 Graph of Deeks’ funnel plot asymmetry test. ESS, effective sample size.
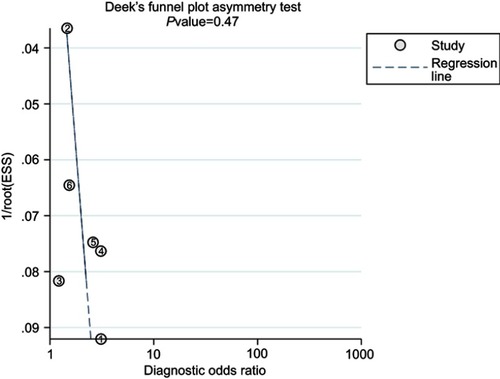
Table 1 Basic characteristics of the included literature
Figure 1 Flow diagram of study search and selection.
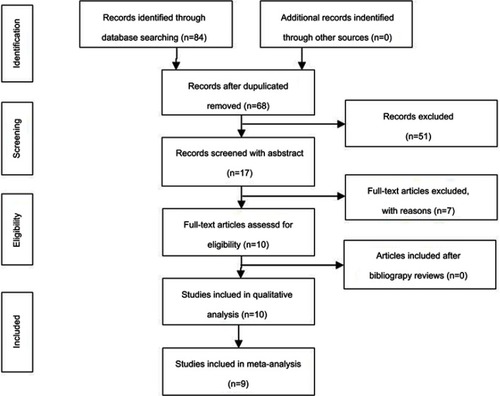
Table 2 Qualitative evaluation of the selected articles using the QUADAS-2 criteria
Figure 2 Risk of bias and applicability concerns summary: review authors’ judgements about each domain for each included study.
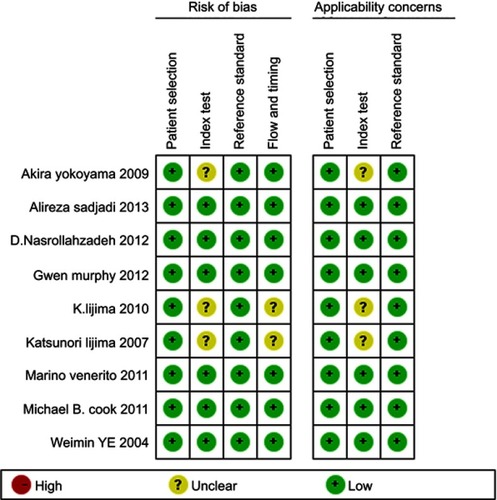
Figure 3 Risk of bias and applicability concerns graph: review authors’ judgements about each domain presented as percentages across included studies.
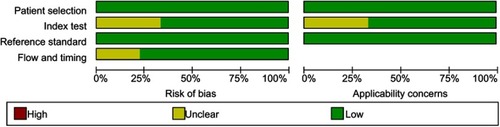
Figure 4 PGI≤70 ng/mL diagnosis ESCC forest plot for sensitivity and specificity.
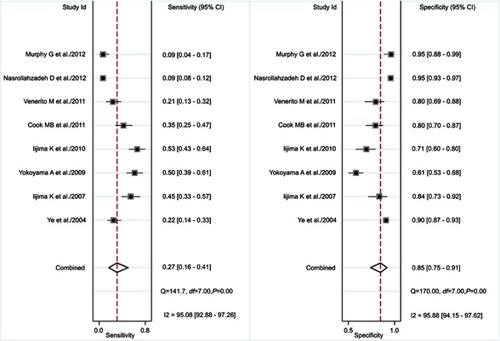
Figure 5 DGI forest map for diagnosis of ESCC with PGI≤70 ng/mL.
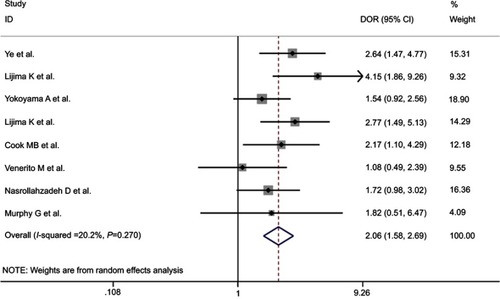
Table 3 Meta-analysis of pepsinogen in the diagnosis of ESCC
Figure 6 SROC curve for diagnosis of ESCC with PGI ≤ 70ng/mL.
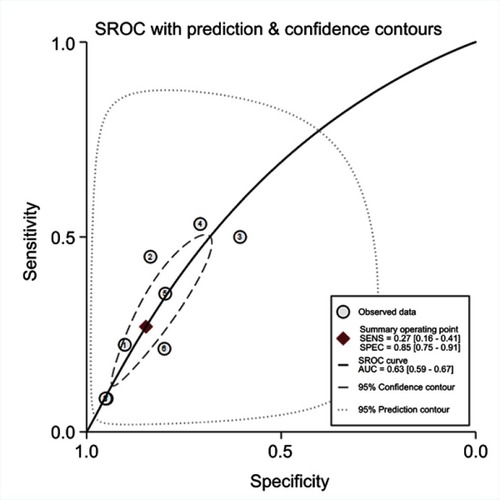
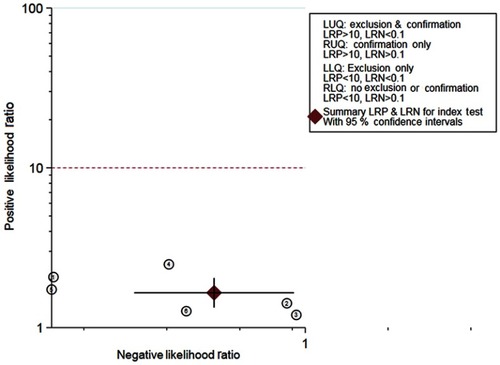
Figure 7 Matrix diagram of diagnostic ESCC with PG ≤ 70ng/mL.
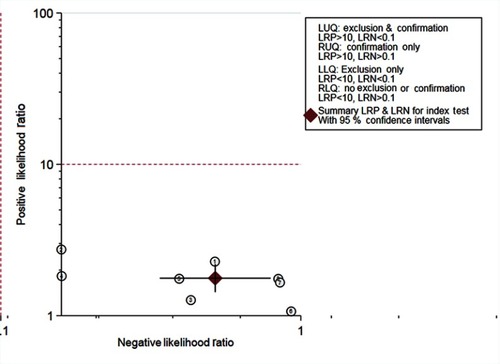
Figure 8 Funnel plot incorporating literature bias analysis.
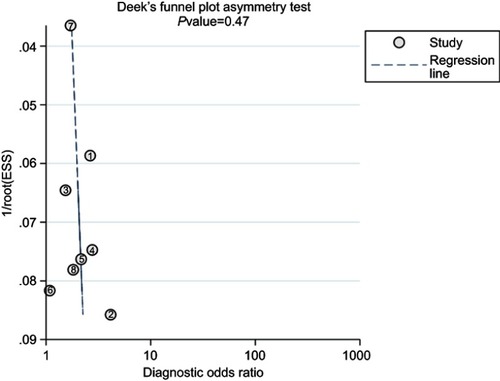
Figure 9 PGR≤3 forest map for diagnosis of sensitivity and specificity of ESCC.
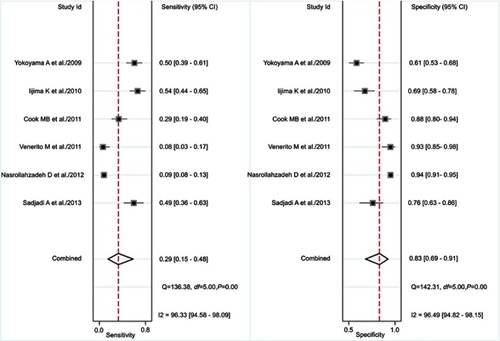
Figure 10 DOR forest map of PGR≤3 diagnostic ESCC.
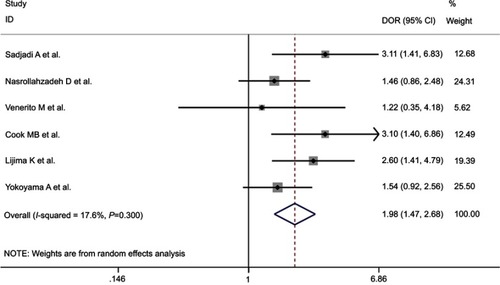
Figure 11 PGR≤3 diagnostic SROC curve.
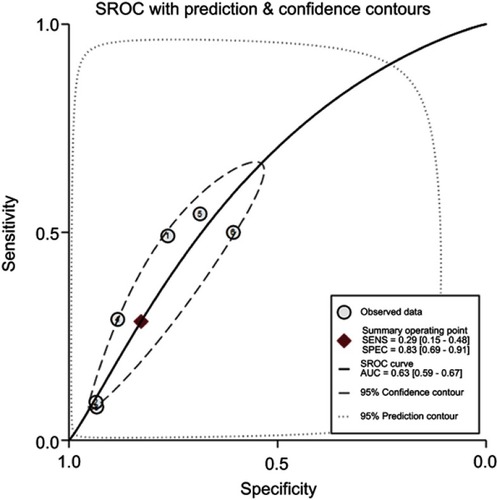
Figure 12 Matrix diagram of diagnostic ESCC with PGR≤3.