Figures & data
Table 1 target sequence of IGF1R shRNA
Figure 1 IGF1R expression is upregulated in NB tissues and cell lines. (A) Expression levels of IGF1R in NB tissues and NGD detected by qRT-PCR. (B) Expression levels of IGF1R in samples from stage 3/4 and stage 1/2 and 4S patients detected by qRT-PCR. (C) Expression levels of IGF1R in the samples from MYCN-amplified and unamplified patients detected by qRT-PCR. (D) Protein expression levels of IGF1R in different NB cell lines by Western blot analysis. **P<0.01, ***P<0.001.
Abbreviations: NB, neuroblastoma; IGF1R, insulin-like growth factor 1 receptor; N.S., not significant.
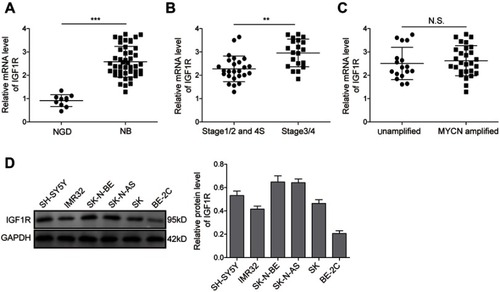
Figure 2 Knockdown of IGF1R inhibits NB cell tumourigenesis. (A and B) IGF1R expression levels in IMR-32 (A) and SH-SY5Y (B) cells transfected with IGF1R shRNA and detected by Western blot. (C and D) Effect of IGF1R on IMR-32 (C) and SH-SY5Y (D) proliferation determined by MTT assay. (E–G) NB cell invasion determined by Transwell assay. (H and I) NB cell migration determined by wound healing assay. *P<0.05, **P<0.01 vs shNC group. All data are shown as the mean±SD based on three independent experiments.
Abbreviations: NB, neuroblastoma; IGF1R, insulin-like growth factor 1 receptor.
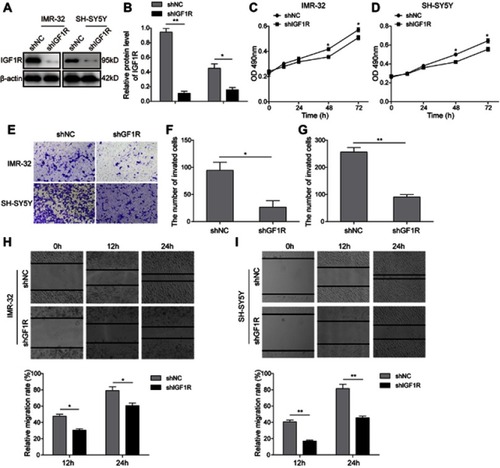
Figure 3 Knockdown of IGF1R inhibits the EMT of NB cells. (A–D) Expression levels and semi-quantitative analysis of MMP3 and MMP9 in IMR-32 (A and C) and SH-SY5Y (B and D) cells determined by Western blot analysis. (E–H) Expression levels and semi-quantitative analysis of EMT related proteins, including Snail, ZEB1, Vimentin, and E-cadherin, in IMR-32 (E and G) and SH-SY5Y (F and H) cells determined by Western blot analysis. (I and J) mRNA expression of EMT-related proteins in IMR-32 (H) and SH-SY5Y (I) cells determined by RT-PCR. *P<0.05, **P<0.01, ***P<0.001 vs shNC group. All data are shown as the mean±SD based on three independent experiments.
Abbreviations: NB, neuroblastoma; IGF1R, insulin-like growth factor 1 receptor; EMT, epithelial-mesenchymal transition.
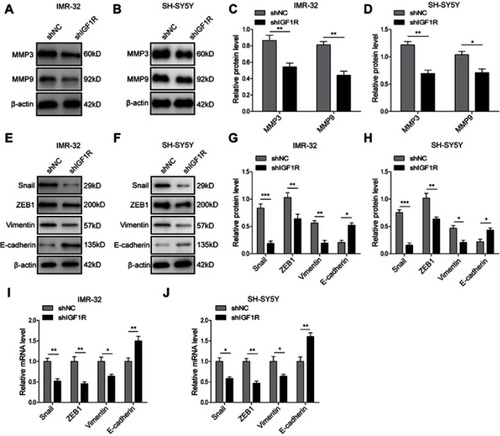
Figure 4 Knockdown of IGF1R inhibits activation of the AKT and STAT3 pathways. Expression levels and semi-quantitative analysis of AKT, STAT3, p-AKT, and p-STAT3 in IMR-32 (A and C) and SH-SY5Y (B and D) cells detected by Western blot. *P<0.05, **P<0.01 vs shNC group. All data are shown as the mean±SD based on three independent experiments.
Abbreviation: IGF1R, insulin-like growth factor 1 receptor.
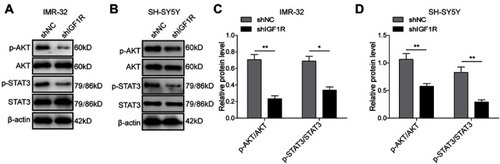
Figure 5 Knockdown of IGF1R attenuates cancer stem cell-like properties in NB cells. The sphere formation assay showed that IGF1R shRNA transfection dramatically reduced the ability of SH-SY5Y (A and B) and IMR-32 (E and F) cells to form spheres compared with the shNC group after 10-day incubation. The colony formation assay showed that much fewer and smaller colonies were observed when IGF1R was knocked down in both SH-SY5Y (C and D) and IMR-32 (G and H) cells. *P<0.05, **P<0.01 vs shNC group. All data are shown as the mean±SD based on three independent experiments.
Abbreviations: NB, neuroblastoma; IGF1R, insulin-like growth factor 1 receptor.
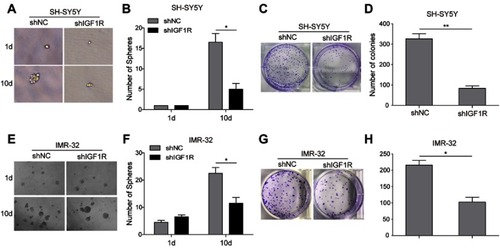
Figure 6 Knockdown of IGF1R downregulates cancer stem cell markers in NB cells. (A–C) Expressions of the stem cell-related transcription factor in SH-SY5Y cells, including OCT4, SOX2, and NANOG detected by Western blot (A and B) and RT-PCR (C). (D–F) Expressions of the stem cell markers in SH-SY5Y cells, including Epcam, CD44, and CD133 detected by Western blot (D and E) and RT-PCR (F). *P<0.05, **P<0.01, ***P<0.001 vs shNC group. All data are shown as the mean±SD based on three independent experiments.
Abbreviations: NB, neuroblastoma; IGF1R, insulin-like growth factor 1 receptor.
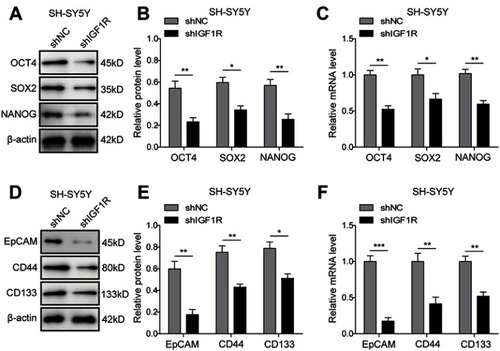
Figure 7 STAT3/AKT pathways are essential for cancer stem cell-like properties in SH-SY5Y cells. (A and B) Inhibition efficiency of STAT3 inhibitor Cryptotanshinone and AKT inhibitor LY294002 validated by Western blot analysis. (C and D) The tumour-sphere formation assay showed that LY294002 or Crypto treatment dramatically reduced the ability of SH-SY5Y cells to form spheres compared with the control group after 10-day incubation. (E and F) The colony formation assay showed that much fewer and smaller colonies were observed when LY294002 or Crypto was used in SH-SY5Y cells. (G and H) Protein expression levels of stem cell-related transcription factor in SH-SY5Y cells detected by Western blot. (I) mRNA expression levels of stem cell-related transcription factor in SH-SY5Y cells detected by RT-PCR *P<0.05, **P<0.01 vs shNC group. All data are shown as the mean±SD based on three independent experiments.
Abbreviations: NB, neuroblastoma; IGF1R, insulin-like growth factor 1 receptor; LY, LY294002.
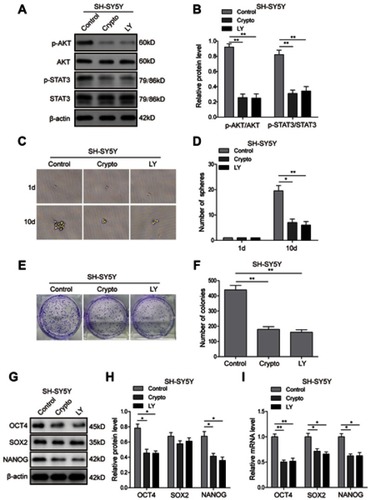
Figure S1 Silencing potency of four shRNAs against IGF1R verified by qPCR.
Abbreviation: IGF1R, insulin-like growth factor 1 receptor. *P<0.05, **P<0.01, ***P<0.001
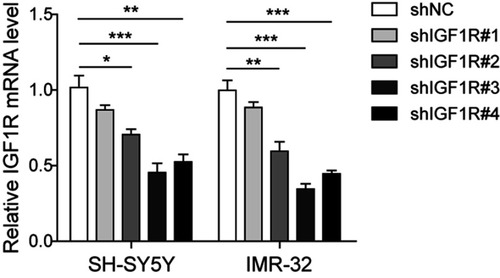
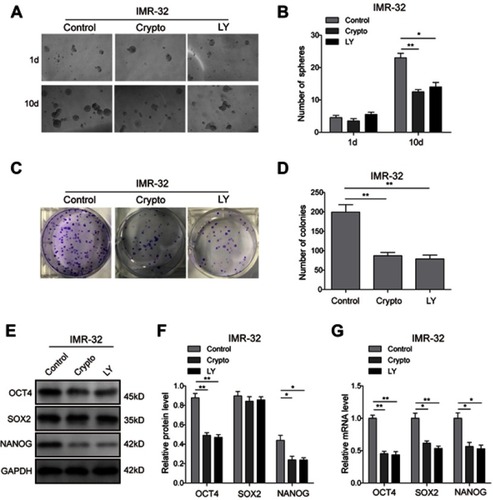
Figure S2 STAT3/AKT pathways are essential for cancer stem cell-like properties in IMR-32 cells. (A and B) The tumour-sphere formation assay showed that the LY294002 or Crypto treatment dramatically reduced the ability of IMR-32 cells to form spheres compared with the control group after 10-day incubation. (C and D) The colony formation assay showed that much fewer and smaller colonies were observed when LY294002 or Crypto was used in IMR-32 cells. (E–G) Protein (E and F) and mRNA (G) expression levels of stem cell-related transcription factor in IMR-32 cells detected by Western blot and RT-PCR. *P<0.05, **P<0.01 vs shNC group. All data are shown as the mean±SD based on three independent experiments.
Abbreviation: LY, LY294002.