
Figures & data
Table 1 Patient characteristics
Figure 1 Univariate analysis of progression-free survival and overall survival.
Abbreviations: NLR, neutrophil-lymphocyte ratio; PLR, platelet-lymphocyte ratio; SII, systemic index of inflammation.
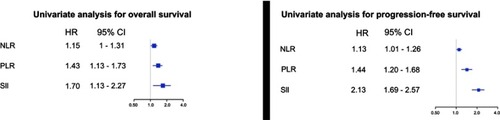
Figure 2 SII value for category of response.
Abbreviation: SII, systemic index of inflammation.
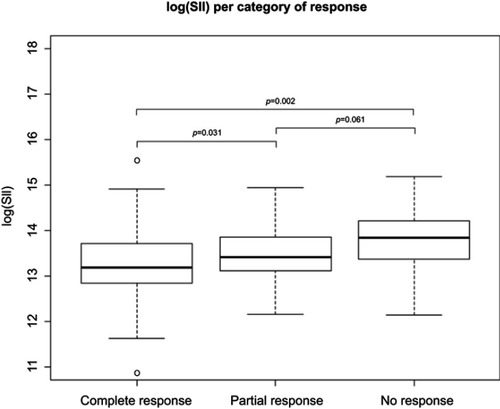
Figure 3 Progression-free survival (left) and overall survival (right) by pre-treatment SII.
Abbreviations: NLR, neutrophil-lymphocyte ratio; PLR, platelet-lymphocyte ratio; SII, systemic index of inflammation.
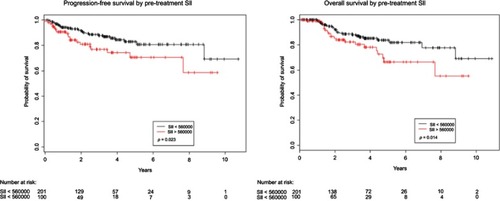
Figure 4 Nomogram with predictors of response to chemoradiotherapy.
Abbreviations: Hb, hemoglobin; SII, systemic index of inflammation.
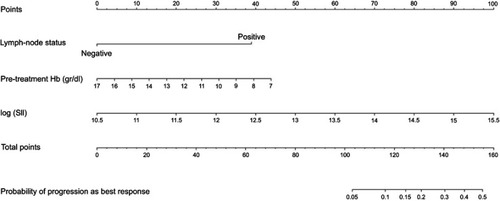
Figure S1 Calibration plot of the external validation of the nomogram.
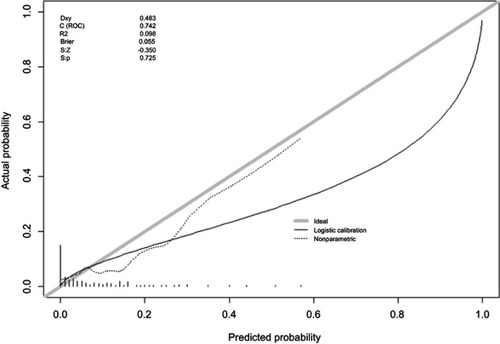
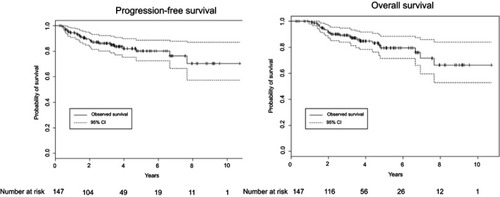
Table S1 Treatment characteristics
Table S2 Results of univariate analysis of the previous study
Table S3 Results of univariate and multivariate logistic model for prediction of nonresponse