Figures & data
Table 1 Correlations between CXCL16 expression and clinicopathological features
Figure 1 Immunohistochemical staining of CXCL16 expression in CRC.
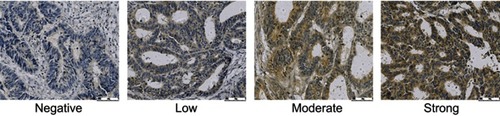
Table 2 Cox proportional hazard regression analysis for overall survival (OS)
Figure 2 The 5-year overall survival rates of CXCL16-positive patients were significantly lower than those of CXCL16-negative patients (P=0.002).
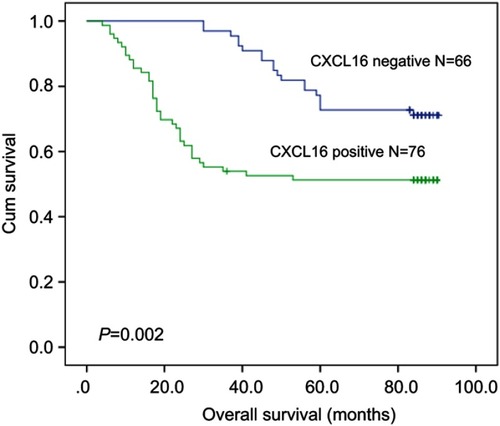
Figure 3 The 5-year overall survival rates were not significantly different between CXCL16-positive and CXCL16-negative patients with stage I/II CRC (P=0.181).
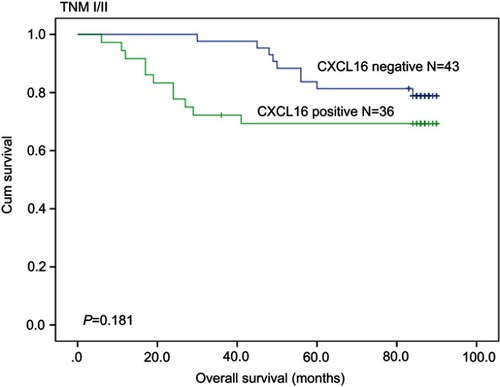
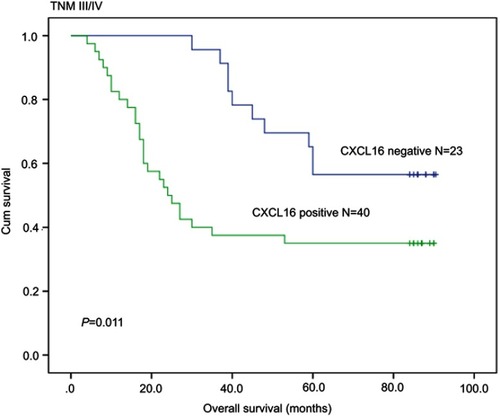
Figure 4 The 5-year overall survival rates of CXCL16-positive patients were significantly lower than those of CXCL16-negative patients with stage III/IV CRC (P=0.011).