Figures & data
Figure 1 Deep sequencing performance. 107 DNA samples derived from 33 HCC tissue specimens, 37 peripheral blood samples, and matched 37 swab samples were subject to deep sequencing, and the performance was evaluated. (A) The distribution of the sequenced fragments of the plasma cfDNA. Three main peaks with lengths of 160 bp, 320 bp, and 480 bp were identified. (B) The distribution of the sequenced fragments of the DNA samples from the HCC tissue specimens. The average read length was approximately 300 bp. The sequencing depths for (C) the plasma cfDNA and (D) the HCC tissue DNA. (E) The background rates. SNVs and germline SNPs were excluded, and the mean and median background rates were calculated.
Abbreviation: HCC, hepatocellular carcinoma.
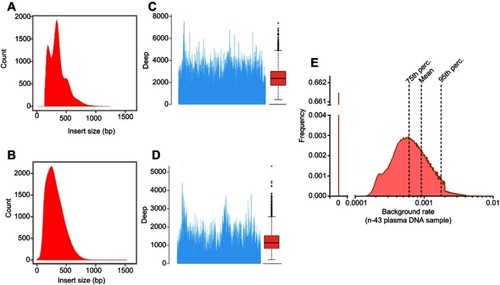
Table 1 Selected candidate genes for mutation frequency analysis among the included HCC patients
Table 2 Comparison of mutation detection rates in the plasma cfDNA and tissue DNA samples of the HCC patients
Figure 2 Detection of the somatic mutations in plasma cfDNA and their performance for the diagnosis of HCC. The selected somatic mutations were examined in plasma cfDNA samples derived from HCC patients (n=37) and healthy individuals (n=6) as controls. (A–C) The numbers of mutations per patient detected in the plasma cfDNA samples in the HCC and control groups. The numbers of mutations reached a peak value at the detection limit of 0.6% (allele), and this was considered as a cutoff value in the subsequent analysis. (D) Comparison of the mutation numbers detected in the AFP-positive group and AFP-negative group with the cutoff value of 0.6% (allele). Based upon the status of AFP, the 37 HCC patients were classified into two subgroups: AFP-negative group (AFP <400, n=22) and AFP-positive group (AFP ≥400, n=15), (E) ROC analysis of the mutations in the HCC and control plasma cfDNA samples. The sensitivity and specificity at the cutoff value of 0.6% were calculated. The AUC was 0.92, with a sensitivity (Sn) of 65% and specificity of 100% for the diagnosis of HCC. The AUC was 0.96 with a sensitivity of 73% and specificity of 100% for HCC patients who were negative for AFP. The AUC value was 0.86 with a sensitivity of 53% and specificity of 100% for HCC patients who were positive for AFP.
Abbreviation: HCC, hepatocellular carcinoma.
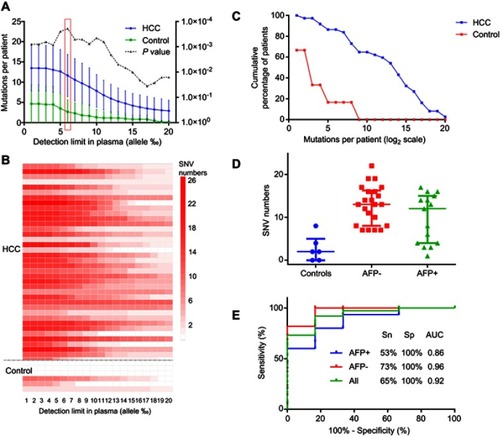
Figure 3 Analysis of the mutation frequency in HCC patients with and without recurrence. The mutation frequencies of the selected candidate genes were examined in the studied HCC patients and were compared between those with and without HCC recurrence. The mutation frequency was significantly greater in the patients with recurrent HCC than in those with non-recurrent HCC.
Abbreviation: HCC, hepatocellular carcinoma.
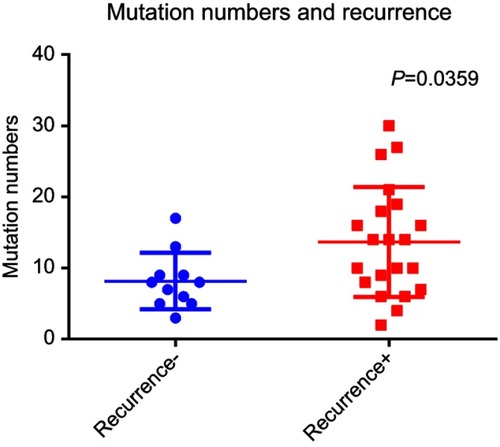
Figure 4 Mutations of the selected panel of genes involved in the cell cycle pathway. The HCC patients were classified into a recurrent HCC group and non-recurrent or naïve HCC group. The mutation frequencies of the selected genes involved in the cell cycle pathway were examined and compared in all HCC cases, cases of recurrent HCC, and cases of non-recurrent HCC. (A) The frequencies of mutations of the genes involved in the cell cycle pathway. (B) Kaplan–Meier recurrence plot for the mutated group and non-mutated group of the selected genes, including ATM, CREBBP, EP300, and RB1 in the cell cycle pathway. (C) Comparative analysis of the profiles of the selected genes in the recurrent versus non-recurrent HCC groups.
Abbreviation: HCC, hepatocellular carcinoma.
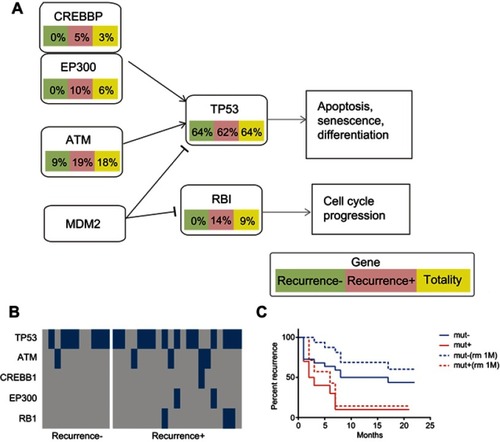
Figure 5 Mutations of the selected panel of genes in the RTK/RAS/PI(3)K signaling pathway. The HCC patients were classified into a recurrent HCC group and non-recurrent or naïve HCC group. The mutation frequencies of the selected genes in the RTK/RAS/PI(3)K signaling pathway were assessed and compared in all HCC cases, cases of recurrent HCC, and cases of non-recurrent HCC. (A) Frequency of mutations in the genes in the RTK/RAS/PI(3)K pathway. (B) Kaplan–Meier recurrence plot for the mutated group and non-mutated group for the selected genes in RTK/RAS/PI(3)K pathway. (C) Comparison of profiles of the selected genes in the RTK/RAS/PI(3)K pathway between the recurrent and non-recurrent HCC groups.
Abbreviation: HCC, hepatocellular carcinoma.
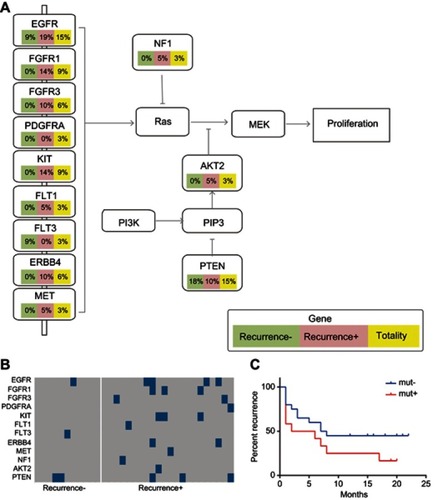
Figure 6 Mutations of the selected panel of genes in the Wnt signaling pathways. The mutation frequencies of the genes (LRP1B, AXIN1, AXIN2, APC, and CTNNB1) in the Wnt signaling pathways were examined and compared in all HCC cases, case of recurrent HCC, and cases of non-recurrent HCC. (A) Frequency of mutations of the selected genes participating in the Wnt signaling pathway. (B) Kaplan–Meier recurrence plot for the mutated group and non-mutated group for the selected genes in the Wnt signaling pathways. (C) Comparison of profiles of the LRP1B, AXIN1, AXIN2, APC, and CTNNB1 genes in the recurrent HCC group versus the non-recurrent HCC group.
Abbreviation: HCC, hepatocellular carcinoma.
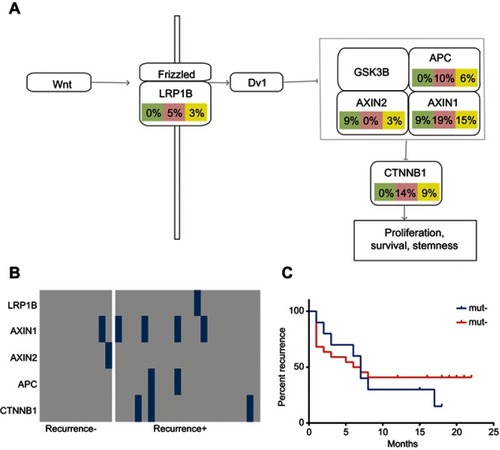
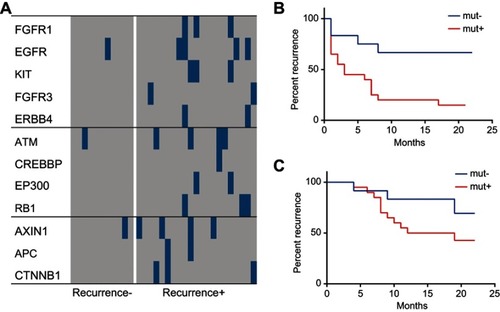
Figure 7 Profiles of the selected panel of genes in the cell cycle, RTK/RAS/PI(3)K, and Wnt signaling pathways and their relationship to survival and recurrence of HCC. The profiles of the significantly altered genes in the cell cycle, RTK/RAS/PI(3)K, and Wnt signaling pathways were compared between the recurrent HCC group and the non-recurrent or naïve HCC group. (A) Comparison of profiles of the significantly altered genes in the cell cycle, RTK/RAS/PI(3)K, and Wnt signaling pathways between the recurrent and non-recurrent HCC groups. (B) Survival plots for the mutated group and non-mutated group for the selected genes in the cell cycle, RTK/RAS/PI(3)K, and Wnt signaling pathways. (C) Recurrence plot for the mutated group and non-mutated group for the selected genes in the cell cycle, RTK/RAS/PI(3)K, and Wnt signaling pathways.
Abbreviation: HCC, hepatocellular carcinoma.