
Figures & data
Figure 1 The patient selection flowchart.
Abbreviations: BMI, body mass index; RCC, renal cell carcinoma.
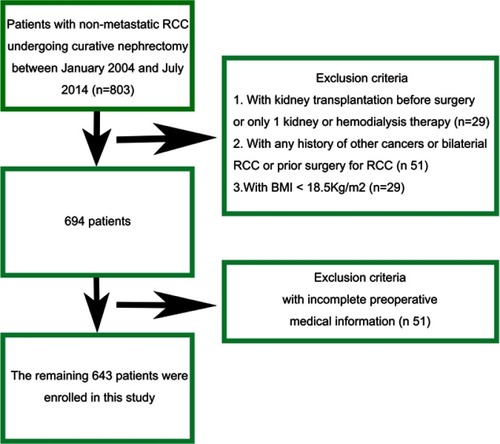
Table 1 Patient characteristics
Figure 2 Correlation between age and BMI. The BMI in men significantly decreased when they were ageing (A); however, the BMI in women increased with increasing age while the relationship was not significant (B).
Abbreviation: BMI, Body mass index.
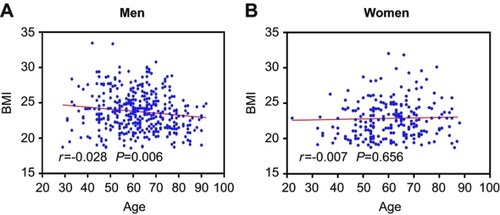
Figure 3 Kaplan-Meier curves for overall survival stratified by BMI in all patients (A), male patients (B), and female patients (C) with non-metastasis RCC.
Abbreviations: BMI, body mass index; RCC, renal cell carcinoma.
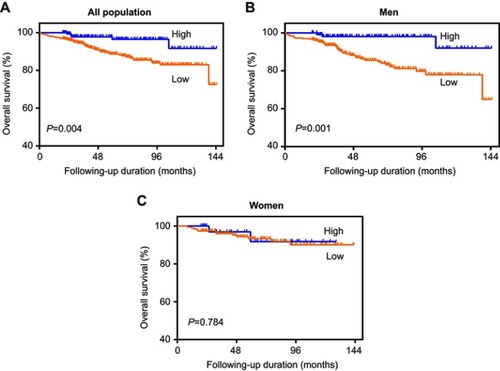
Figure 4 HRs and 95% CIs for overall survival by BMI as categorical variable (A) or continuous variable (B).
Abbreviation: BMI, body mass index.
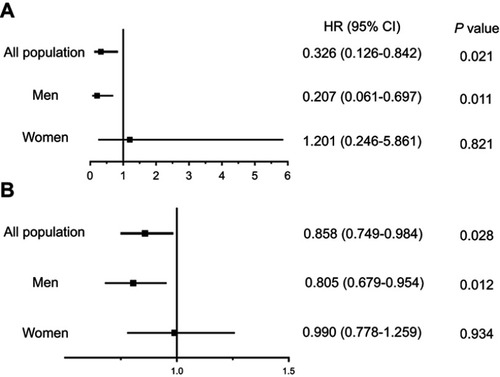
Table 2 Multivariate analysis of variables for the prediction of OS in all patients
Table 3 The significance of BMI for the prediction of OS using multivariate analysis by sex
Figure 5 Kaplan-Meier curves for cancer-specific survival stratified by BMI in all patients (A), male patients (B), and female patients (C) with non-metastasis RCC. Abbreviations: BMI, body mass index; RCC, renal cell carcinoma.
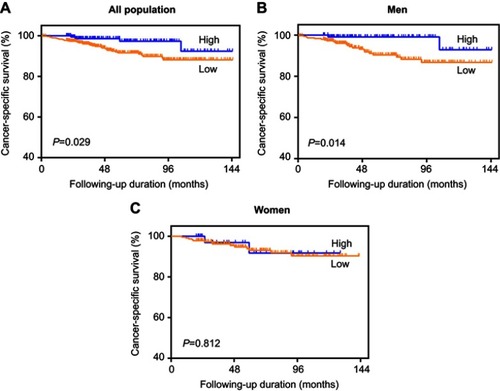
Figure 6 HRs and95% CIs for cancer-specific survival by BMI as categorical variable (A) or continuous variable (B).
Abbreviation: BMI, body mass index.
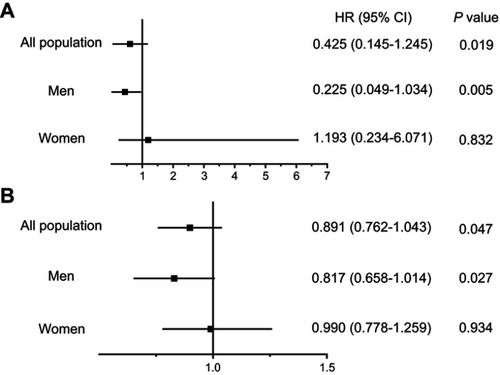
Table 4 Multivariate analysis of variables for the prediction of CSS in all patients
Table 5 The significance of BMI for the prediction of CSS using multivariate analysis by sex
Figure 7 Kaplan-Meier curves for metastasis-free survival stratified by BMI in all patients (A), male patients (B), and female patients (C) with non-metastasis RCC. Abbreviations: BMI, body mass index; RCC, renal cell carcinoma.
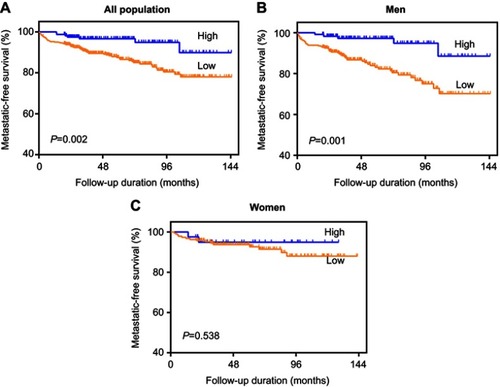
Figure 8 HRs and 95% CIs for metastasis-free survival by BMI as categorical variable (A) or continuous variable (B).
Abbreviation: BMI, body mas index.
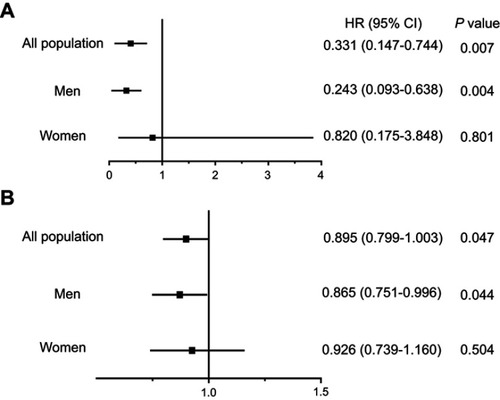
Table 6 Multivariate analysis of variables for the prediction of MFS in all patients
Table 7 The significance of BMI for the prediction of MFS using multivariate analysis by sex
Table 8 Clear cell RCC patient characteristics*Statistically significant
Table 9 The significance of BMI for the prediction of OS, CSS, and MFS using multivariate analysis by sex among clear cell RCC patients
Table S1 Univariate analysis of variables for the prediction of overall survival in all patients
Table S2 Univariate analysis of variables for the prediction of cancer-specific survival in all patients
Table S3 Univariate analysis of variables for the prediction of metastasis-free survival in all patients