
Figures & data
Table 1 Clinical and pathological characteristic of the population
Figure 1 Comparison of PSApostd3/PSApre between PSA recurrence groups and PSA recurrence-free groups.
Abbreviation: PSApostd3/PSApre, The ratio of the prostate-specific antigen (PSA) on day 3 postop as the numerator and the pre-operative PSA as the denominator.
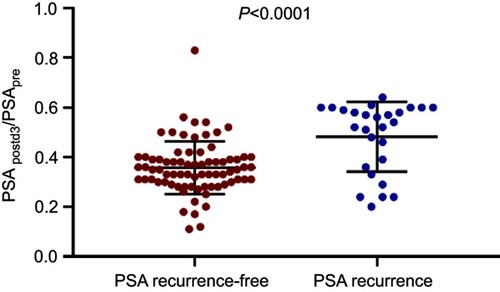
Figure 2 Receiver operating characteristic (ROC) curve of PSApostd3/PSApre to predict PSA recurrence (n=102, area under curve=0.760, cut-off=0.453, Youden=0.557, sensitivity=0.704, 1-specificity=0.147, P<0.0001).
Abbreviation: PSApostd3/PSApre, The ratio of the prostate-specific antigen (PSA) on day 3 postop as the numerator and the pre-operative PSA as the denominator.
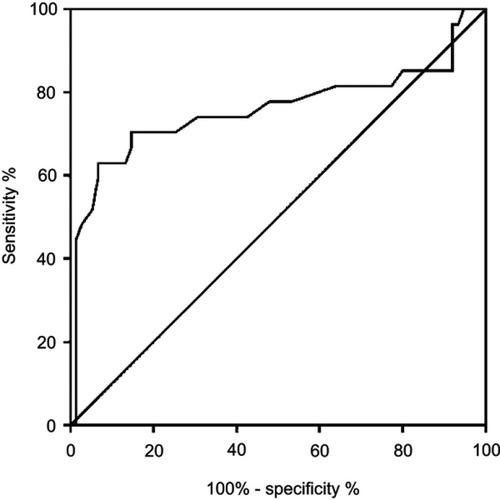
Table 2 Fisher’s exact test results of different factors (n=102)
Table 3 Multivariable logistic regression analyses for developing PSA recurrence
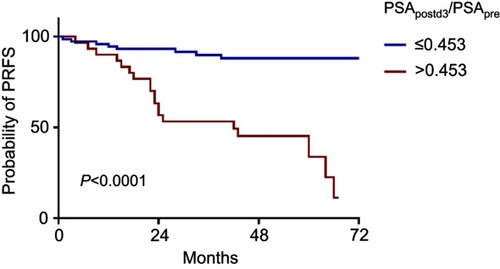
Figure 3 Kaplan-Meier estimates of the probability of PRFS according to PSApostd3/PSApre.
Abbreviations: PRFS, PSA recurrence-free survival; PSApostd3/PSApre, The ratio of the prostate-specific antigen (PSA) on day 3 postop as the numerator and the pre-operative PSA as the denominator.
Data availability
The datasets used and/or analyzed during the current study are available from the corresponding author on reasonable request.