Figures & data
Figure 1 Metabolic stress upregulates STC2 expression in CNE2 cells.
Notes: CNE2 cells were cultured under hypoxia (H) or combined hypoxia and glucose starvation (H+S) conditions for 16 hrs. (A) Whole cell lysates were prepared, and Western blotting was used to determine the levels of STC2. HIF-1α was examined as indicator of hypoxia, and α-tubulin was determined as loading control. (B) Three independent Western blots performed under the identical experimental conditions, and results were quantified based on signal density. Error bars are mean± SD(n=3). **P<0.01. (C) Total RNA was extracted, and mRNA levels of STC2 were determined by quantitative real-time PCR after reverse transcription. *P<0.05.
Abbreviations: N, normal culture condition (21% O2, 25 mM glucose); H, hypoxia (1% oxygen); H+S, hypoxia (1% oxygen) and glucose starvation (2.5 mM).
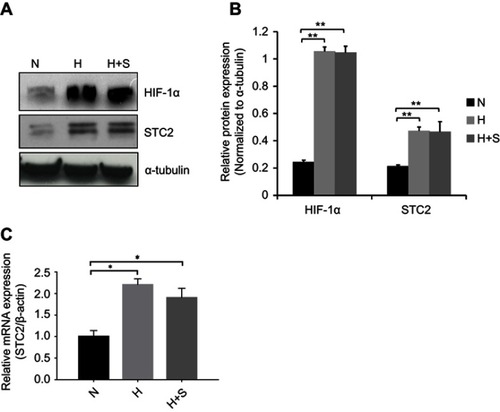
Figure 2 Establishment and characterization of STC2 knockout CNE2 cells.
Notes: (A) CRISPR/Cas9 was used to knock out STC2 in CNE2 cells. The DNA sequence encoding gRNA was designed to target an exon region corresponding to nt#803–823. (B) Protein levels of STC2 and α-tubulin (as loading control) were determined by Western blots to screen for knockout lines. ***P<0.001. (C) Clone#1 and #3 were further purified, expanded and named as CNE2-STC2-KOA and CNE2-STC2-KOB, which were cultured in either normoxic or hypoxic condition. Hypoxia-mediated upregulation of STC2 was apparent in parental CNE2 line, but only barely seen in the two knockout lines. (D) Loss of STC2 does not alter the general morphology of CNE2 cells. Cells were grown in low density to observe colonized proliferation. Images were taken under light microscope (100 ×). Scale bar=25 µm. (E) Loss of STC2 does not impair the tumorigenic ability of CNE2 cells. CNE2 and CNE2-STC2-KO cells were digested with trypsin to prepare single cell suspension in serum-free medium. For each cell line, cells were subcutaneously injected into three nude mice (1×10⁶ cells each). The mice were housed up to 8 weeks after injection. All mice injected with CNE2 or CNE2-STC2-KO lines formed tumor xenografts, which were confirmed by pathologists. The STC2 expression status was confirmed by immunohistochemical staining. Images were taken under light microscope (400 ×). Scale bar =50 µm.
Abbreviations: N, normal culture condition as control; H, hypoxia (1% Oxygen); #A, CNE2-STC2-KOA; #B, CNE2-STC2-KOB.
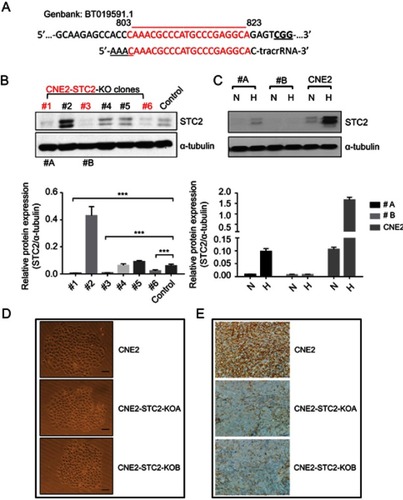
Figure 3 Loss of STC2 enhances radiation-triggered death of NPC cells.
Notes: CNE-2, CNE2-STC2-KOA and CNE2-STC2-KOB cells were cultured under normoxic (21% O2) or hypoxic (1% O2) condition to reach 80% confluence and irradiated with 4 Gy X-radiation. Six hours later, cells were digested with 0.25% trypsin and cell survival was determined by Trypan blue staining. Living or dead cells were counted under a light microscope. Cell survival rates were calculated as: (Number of living cells/Total cell numbers)×100%. *P<0.05.
Abbreviation: NS, not significant.
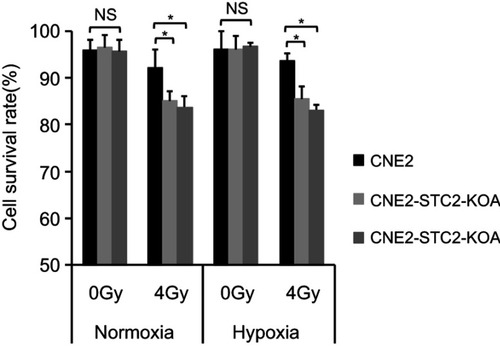
Figure 4 Loss of STC2 reduces clonogenic ability of CNE2 post-radiation.
Notes: Radiation sensitivity was determined by standard clonogenic assays. CNE2-STC2-KOA, CNE2-STC2-KOB and control CNE2 cells were plated in 6-well plates, and cultured under normoxic (A,B) and hypoxic (C,D) conditions to achieve 80% confluency. Then, cells were irradiated with indicated doses and returned to original culture conditions with the change of culture media every 7 days. After 14 days, colonies were stained with crystal violet and counted to calculate the survival fractions. Cell survival curves were fitted based on standard multitarget-single hit model [SF=1–(1–e−D/D0)N], and D0, Dq, N, SF2 and SER values are listed in .
![Figure 4 Loss of STC2 reduces clonogenic ability of CNE2 post-radiation.Notes: Radiation sensitivity was determined by standard clonogenic assays. CNE2-STC2-KOA, CNE2-STC2-KOB and control CNE2 cells were plated in 6-well plates, and cultured under normoxic (A,B) and hypoxic (C,D) conditions to achieve 80% confluency. Then, cells were irradiated with indicated doses and returned to original culture conditions with the change of culture media every 7 days. After 14 days, colonies were stained with crystal violet and counted to calculate the survival fractions. Cell survival curves were fitted based on standard multitarget-single hit model [SF=1–(1–e−D/D0)N], and D0, Dq, N, SF2 and SER values are listed in Table 1.](/cms/asset/00126cc5-6162-430c-8b13-1e9fc2601a95/dcmr_a_12186347_f0004_c.jpg)
Table 1 Loss of STC2 sensitizes CNE2 cells
Figure 5 Loss of STC2 Enhances Radiation-Triggered Apoptosis.
Notes: (A) CNE2, CNE2-STC2-KOA and CNE2-STC2-KOB cells were cultured under either normoxic or hypoxic conditions to 80% confluence and exposed to 4 Gy of X-radiation. Six hours after radiation, apoptosis was determined by Annexin V and PI staining followed by flow cytometric analyses. The percentage of apoptotic cells was shown as the means±SD from three biological replicates. (B) Histograms show the total apoptotic rates (late+early phases). Error bars are mean± SD (n=3). *P<0.05.
Abbreviation: NS, not significant.
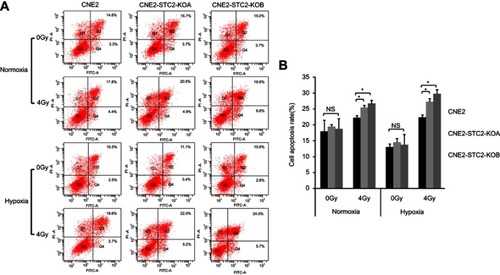
Figure 6 Loss of STC2 promotes radiation-triggered cell cycle alteration.
Notes: (A) Cells were cultured under either normoxic or hypoxic conditions to 80% confluence. Then, cells were exposed to 4 Gy of X-radiation and cultured for another 6 hrs. The cells were trypsinized and cell cycle distribution was determined by PI staining and flow cytometric analysis of DNA contents. (B, C) Results from triplicate experiments as shown in panel A were quantified, and the percentages of cells in the G0/G1, S and G2/M phases were presented as means±SD. *P<0.05; **P<0.01; ***P<0.001.
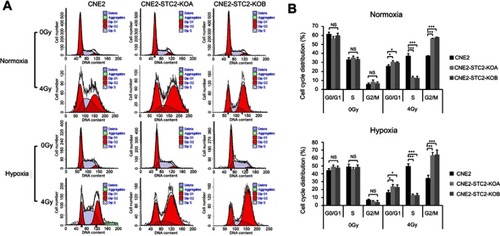
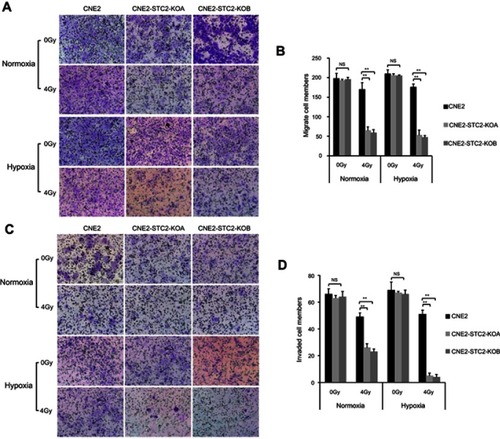
Figure 7 Loss of STC2 undermines migration and invasion of irradiated NPC cells.
Notes: (A) Transwell culture analyses were used to examine migrating ability. CNE2, CNE2-STC2-KOA and CNE2-STC2-KOB cells were seeded on the upper chambers of Transwell plates and cultured for 24 hrs before analysis. The insert membranes were removed, stained with crystal violet and examined under light microscope (200×) to determine migrated cells at the bottom of membranes. (B) Numbers of cells migrating through the insert membranes were counted and mean ±SD from three triplicates was plotted. **P<0.01. (C) Cell invasion was tested with a Matrigel-based in vitro assay. Representative images showing cells on the bottoms of the Millicell® Hanging cell culture inserts, which were cells invaded through the Matrigel gel and insert membrane. (D) The numbers of invaded cells were counted; and mean±SD from three triplicates was plotted. **P<0.01.