Figures & data
Table 1 Associations of clinicopathological characteristics with CADM1-AS1 expression in hepatocellular carcinoma
Figure 1 CADM1-AS1 expression and transfection efficiency in HCC cell line. (A) CADM1-AS1 expression in cancerous and non-cancerous tissues, determined in ISH (n=90). (B) Representative images for ISH detecting CADM1-AS1 expression in cancerous and non-cancerous tissues. (C) Kaplan-Meier survival analysis of overall survival in HCC patients based on CADM1-AS1 expression. Differences were assessed by the log-rank test (n=90). (D) Levels of CADM1-AS1 in HCC (HepG2, BEL-7402 and Huh-7) and normal hepatocyte (LO2) cell lines, detected by qRT-PCR. (E) Lentivirus transfection efficiency and cell morphology were observed under an inverted fluorescence microscope using bright and GFP field channels (x100 and x400 magnification). (F) RT-qPCR were performed to detect the expression levels of CADM1-AS1, with GAPDH as a reference control. Representative images from experiments performed three times are shown (***P<0.001).
Abbreviations: HCC, hepatocellular carcinoma; ISH, In situ hybridization; GFP, Green Fluorescent Protein; RT-qPCR, real-time quantitative PCR; CADM1-AS1, cell adhesion molecule 1 antisense RNA 1.
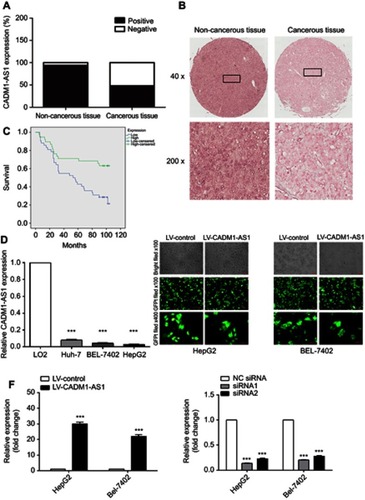
Table 2 Univariate and multivariate analyses of factors associated with overall survival in patients with hepatocellular carcinoma
Figure 2 Effects of CADM1-AS1 on HCC cell proliferation in vitro. (A) Growth curves for HepG2 and BEL-7402 cells after transfection were determined by the CCK-8 assay. (B) The EDU assay was performed to determine the proliferation ability after transfection. (C) Colony formation assay was performed to assess the colony forming ability after transfection. Representative images from experiments performed three times are shown (*P<0.05; **P<0.01; ***P<0.001).
Abbreviations: CADM1-AS1, cell adhesion molecule 1 antisense RNA 1; HCC, hepatocellular carcinoma; CCK-8, Cell Counting Kit-8; EDU, 5‐Ethynyl‐2′‐deoxy-uridine.
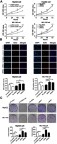
Figure 3 Effects of CADM1-AS1 on migration, invasion and cell-cycle on HCC cells in vitro. (A) Transwell invasion assay was performed to determine the invasive ability. (B) Transwell migration assay was performed to determine the migratory ability. (C) The scratch-wound assay was performed to detect the migratory ability. (D) Cell cycle progression was evaluated by flow cytometry. Representative images from experiments performed three times are shown (*P<0.05; **P<0.01; ***P<0.001).
Abbreviations: CADM1-AS1, cell adhesion molecule 1 antisense RNA 1; HCC, hepatocellular carcinoma.
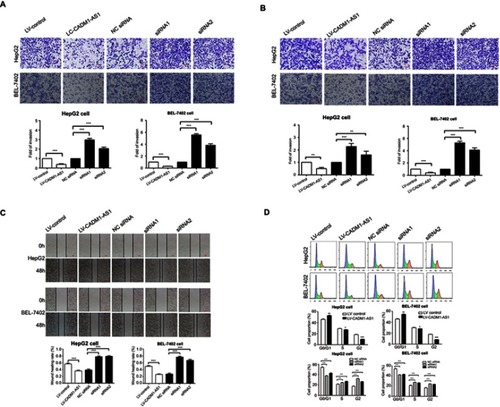
Figure 4 Mechanism of CADM1-AS1 on the AKT/GSK-3β signaling pathway and HCC cell-cycle progression in vitro. PTEN, total AKT, total GSK-3β, p-AKT and p-GSK-3β levels were examined by Western blot in HepG2 cell after transfection. GAPDH was used as the loading control. PTEN, total AKT, total GSK-3β, p-AKT and p-GSK-3β levels were examined by Western blot in BEL-7402 cell after transfection. GAPDH was used as the loading control. P15, P21, P27, CDK2, CDK4, CDK6, cyclinD and cyclinE protein levels were determined in HepG2 cells after transfection. P15, P21, P27, CDK2, CDK4, CDK6, cyclinD and cyclinE protein levels were determined in BEL-7402 cells after transfection. Representative images from experiments performed three times are shown (*P<0.05; **P<0.01; ***P<0.001).
Abbreviations: CADM1-AS1, cell adhesion molecule 1 antisense RNA 1; HCC, hepatocellular carcinom.
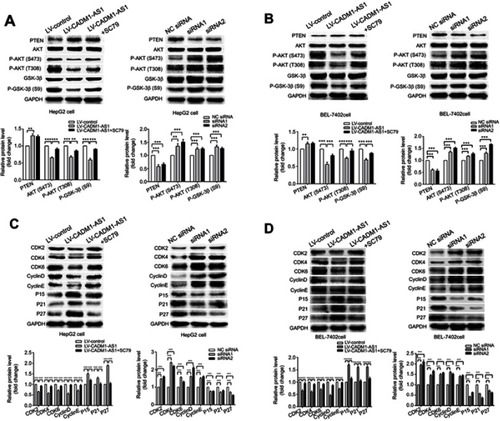
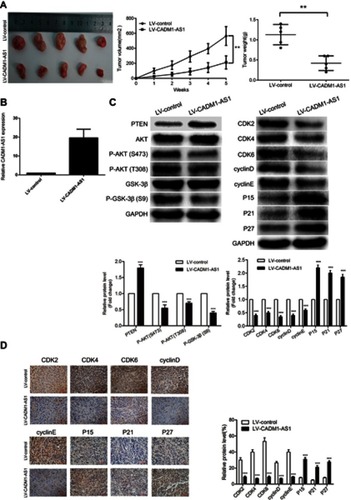
Figure 5 CADM1-AS1 overexpression suppresses HepG2 cell growth in vivo. (A) Tumor volumes and weighs of Xenograft tissues. (B) The expression of CADM1-AS1 was detected by qRT-PCR in xenograft tumor tissues. GAPDH was used as a loading control. (C) PTEN/AKT/GSK-3β signaling pathway and cell cycle regulators protein levels were examined by Western blotting in xenograft tumor tissues. GAPDH was used as a loading control. (D) Representative IHC staining images of P15, P21, P27, CDK2, CDK4, CDK6, cyclinD and cyclinE expression levels in xenograft tumor tissues Representative images from experiments performed three times are shown (**P<0.01; ***P<0.001).
Abbreviations: CADM1-AS1, cell adhesion molecule 1 antisense RNA 1; RT-qPCR, real-time quantitative PCR; IHC, immunohistochemical.