Figures & data
Figure 1 NAT10 expression was regulated by miR-6716-5p. (A) NAT10 might be regulated by miR-376a-5p, miR-212-3p, miR-1468-3p and miR-6716-5p according to two prediction software packages. (B) Illustration of binding site between putative miRNAs and the NAT10 3ʹ-UTR was indicated. (C) HCT116 cells were transfected putative miRNAs mimics and harvested. NAT10 protein level was detected by western blotting and NAT10 protein level was quantified by image J software. (D) LoVo cells were transfected putative miRNAs mimics and harvested. NAT10 protein level was detected by western blotting and NAT10 protein level was quantified by image J software. Error bars represent the SD from three independent experiments. P-values were obtained from Student’s t test. *P<0.05.
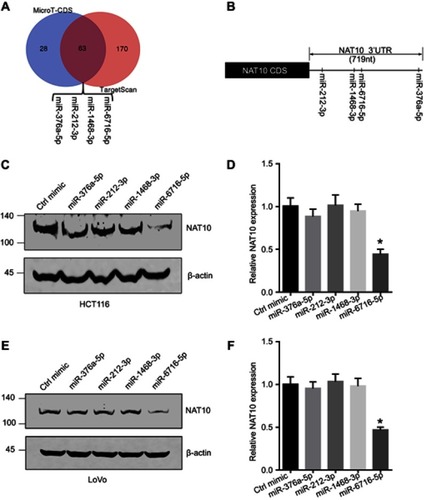
Figure 2 miR-6716-5p bound to the 3ʹ-UTR of NAT10 mRNA to inhibit expression of NAT10. (A) HCT116 cells were transfected with either miR-6716-5p mimic or inhibitor. Seventy-two hours later, cells were harvested and lysed. Then, NAT10 protein and mRNA expression levels were detected by western blotting and RT-qPCR analysis, respectively. (B) LoVo cells were transfected with either miR-6716-5p mimic or inhibitor. Then, cells were harvested and total proteins were extracted. NAT10 protein and mRNA levels were detected by western blotting and RT-qPCR analysis, respectively. (C) Schematic diagram of pmirGLO luciferase reporter vector was illustrated and the predicted miR-6716-5p binding site in 3ʹ-UTR wild-type sequence of NAT10 (pmirGLO-NAT10-3ʹUTR) and the designed mutant sequence (pmirGLO-NAT10-3ʹUTRm) were indicated. (D) The indicated vectors and miR-6716-5p mimic were transfected into HEK293T cells. Twenty-four hours later, cells were harvested and lysed. Then, the firefly and renilla luciferase activities were measured and analyzed according to the manufacturer’s instructions. Luciferase activities were assessed and normalized. (E) HCT116 cells were transfected with the indicated vectors. Twenty-four hours later, the firefly and renilla luciferase activities were measured and analyzed according to the manufacturer’s instructions. (F) HEK293T cells were transfected as indicated and cultured for 24 hrs. Then, the firefly and renilla luciferase activities were measured and analyzed according to the manufacturer’s instructions. (A, B) Error bars represent the SD from three independent experiments. *P<0.05. (D–F) Data were presented as the mean±SD (n=6, each group). P-values were obtained from Student’s t test. *P<0.05.
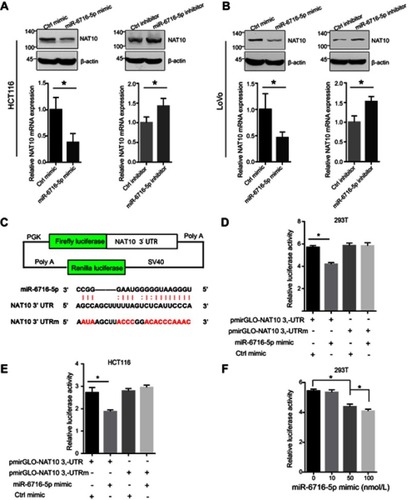
Table 1 Relationship between miR-6716-5p expression and clinical characteristics in colorectal cancer patients
Table 2 Relationship between miR-6716-5p expression and clinical characteristics in colorectal cancer with liver metastasis patients
Figure 3 miR-6716-5p level was correlated with liver metastasis and survival of CRC patients. (A) Kaplan–Meier analysis for overall survival (OS) rate between miR-6716-5p high-expression group and miR-6716-5p low-expression group in CRC patients. (B) Relative miR-6716-5p level was analyzed between non-metastatic CRC (NMCRC) patients and CRC with liver metastasis (CRLM) patients. (C) Kaplan–Meier analysis for OS rate between miR-6716-5p high group and miR-6716-5p low group in CRLM patients. (D) Relative NAT10 mRNA expression was analyzed between miR-6716-5p high group and miR-6716-5p low group. (E) Correlation between miR-6716-5p level and NAT10 mRNA level was calculated according to Spearman’s rank correlation coefficient in CRC specimen (n=80). CRLM represents CRC with liver metastasis. NMCRC represents non-metastatic CRC. (B, D) The Mann–Whitney U test was used to compare the levels of NAT10 mRNA or miR-6716-5p between groups and horizontal line was the mean value in two groups, respectively.
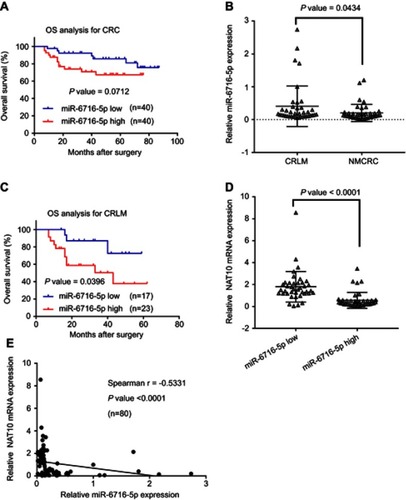
Figure 4 miR-6716-5p promoted cell migration and invasion by downregulating NAT10 expression. (A) HCT116 cells were transfected as indicated. The ability of cell migration and invasion were assessed by transwell assay. (B) The relative migration index of HCT116 cells was calculated. (C) The relative invasion index of HCT116 cells was calculated. (D) LoVo cells were transfected as indicated. Then, the ability of cell migration and invasion were assessed by transwell assay. (E) The relative migration index of LoVo cells was calculated. (F) The relative invasion index of LoVo cells was calculated. (G) HCT116 cells were transfected as indicated. The ability of cell migration and invasion were assessed by transwell assay. (H) The relative migration index of HCT116 cells was calculated. (I) The relative invasion index of HCT116 cells was calculated. (J) LoVo cells were transfected as indicated. Then, the ability of cell migration and invasion were assessed by transwell assay. (K) The relative migration index of LoVo cells was calculated. (L) The relative invasion index of LoVo cells was calculated. Error bars represent the SD from three independent experiments. P-values were obtained from Student’s t test. *P< 0.05.
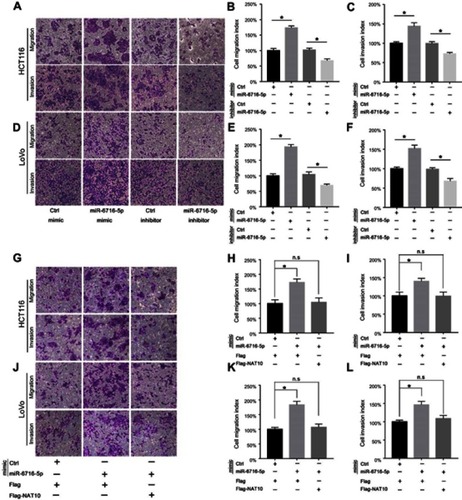
Figure 5 miR-6716-5p had no effect on cell proliferation and apoptosis. (A, B) HCT116 or LoVo cells were transfected with either miR-6716-5p mimic or control mimic. Forty-eight hours later, 1,000 cells were seeded into 96-well or 6-well plates and cultured with 10% serum containing media. The ability of cell proliferation ability was assessed by cell viability assay and colony formation assay. (C, D) HCT116 or LoVo cells were transfected with either miR-6716-5p inhibitor or control inhibitor. Forty-eight hours later, 1,000 cells were seeded into 96-well or 6-well plates and cultured with 10% serum containing media. The ability of cell proliferation was assessed by cell viability assay and colony formation assay. (E, F) HCT116 or LoVo cells were transfected with either miR-6716-5p mimic or control mimic. Then, the apoptosis rate of cells was assessed by flow cytometry. (G, H) HCT116 or LoVo cells were transfected with either miR-6716-5p inhibitor or control inhibitor. Then, the apoptosis rate of cells was assessed by flow cytometry. Error bars represent the SD from three independent experiments. P-values were obtained from Student’s t test. n.s. represents no significance.
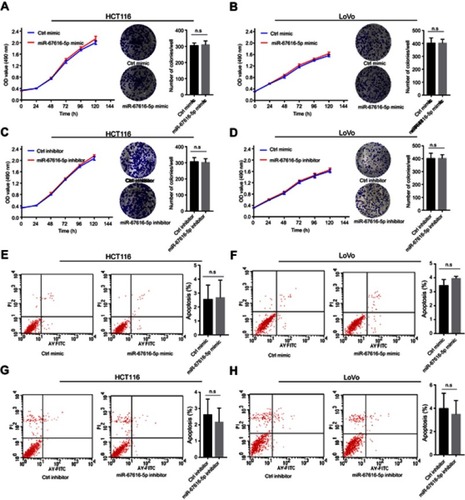
Figure 6 miR-6716-5p may downregulate E-cadherin levels through inhibiting NAT10 expression. (A) HCT116 cells were transfected with the indicated miRNA mimic or inhibitor. Seventy-two hours later, cells were harvested and lysed. NAT10 and E-cadherin protein levels were detected by western blotting. (B) LoVo cells were transfected as indicated. Then, NAT10 and E-cadherin protein levels were detected by western blotting. (C) HCT116 cells were transfected with siRNAs or plasmid as indicated. Then, cells were harvested and total proteins were extracted. NAT10 and E-cadherin protein expression levels were detected by western blotting. (D) LoVo cells were transfected with siRNAs or plasmid as indicated. Then, NAT10 and E-cadherin protein levels were detected by western blotting.
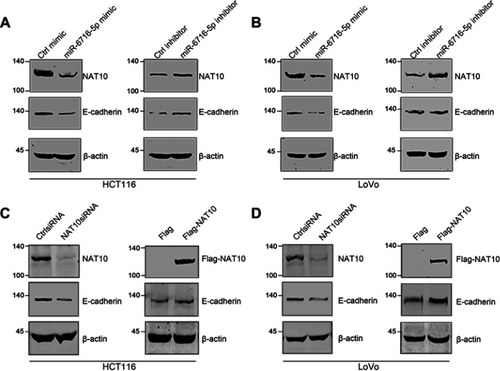
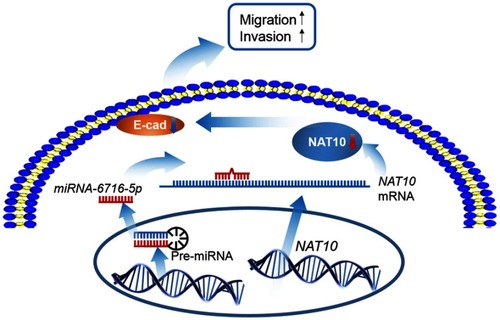
Figure 7 Working model depicting the role of the miR-6716-5p/NAT10 in CRC progression. MiR-6716-5p downregulates the expression of NAT10, which could downregulate E-cadherin level, and in turn promotes CRC cell migration and invasion.