
Figures & data
Figure 1 miR-101 had reduced expression levels in DLBCL.
Notes: (A) miR-101 expression levels were measured in DLBCL and normal lymph node tissues by qRT-PCR. *Compared with NC, P<0.001. (B) miR-101 expression levels were measured in DLBCL cell lines by qRT-PCR. *Compared with NC, P<0.001.
Abbreviations: DLBCL, diffuse large B cell lymphoma; NC, normal control.
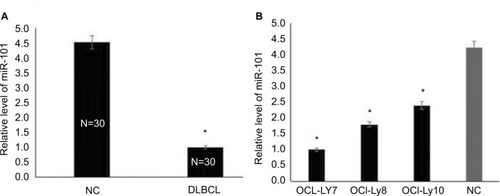
Table 1 The correlation between miR-101 expression and clinicopathological features was analyzed in DLBCL
Figure 2 miR-101 down-regulation regulated cell apoptosis and proliferation in DLBCL.
Notes: (A) The down-regulation and up-regulation of miR-101 in OCL-LY8 cells were validated by qRT-PCR. *Compared with control, P<0.001. (B) MTT assay revealed that miR-101 regulated cell proliferation. (C) Flow cytometric analysis revealed that miR-101 regulated cell apoptosis.
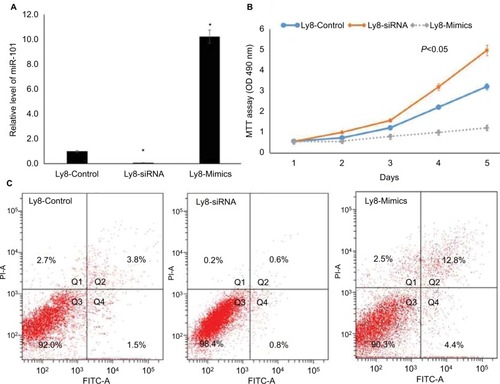
Figure 3 KDM1A is the target of miR-101.
Notes: (A) KDM1A was the predicted target of miR-101 by TargetScanHuman 7.1. (B) KDM1A was highly expressed in DLBCL tissues compared with those in normal tissues. *Compared with NC, P<0.001. (C) miR-101 negatively regulated the mRNA level of KDM1A. *Compared with control, P<0.001. (D) miR-101 negatively regulated the protein level of KDM1A.
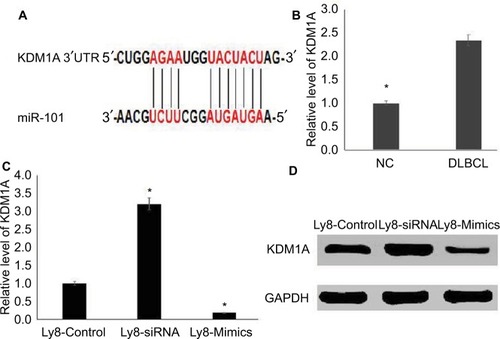
Figure 4 miR-101 negatively regulated KDM1A to affect cell proliferation and apoptosis.
Notes: (A) KDM1A down-regulation didn’t affect the expression of miR-101. *Compared with control, P<0.001. (B) MTT assay shows that KDM1A down-regulation resulted in the inhibition of cell proliferation and partially enhanced the miR-101-induced inhibition of cell proliferation. (C) Flow cytometric analysis revealed that KDM1A down-regulation promoted cell apoptosis and partially enhanced the miR-101-induced promotion of cell apoptosis.
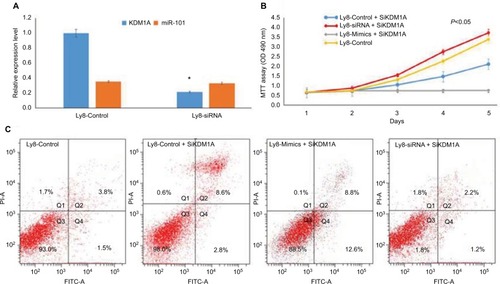
Table 2 The correlation between KDM1A expression and clinicopathological features was analyzed in DLBCL