Figures & data
Figure 1 Workflow of the screening and validation procedures used in this study. Abbreviations: LUAD, lung adenocarcinoma; RFS, recurrence-free survival.
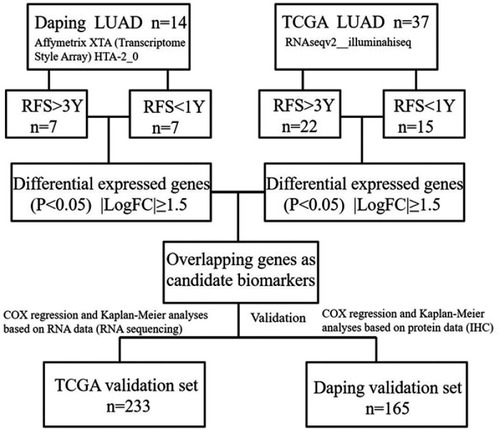
Table 1 Clinical characteristics of the Daping and TCGA discovery sets
Table 2 Clinical characteristics of the Daping and TCGA validation sets
Table 3 Overlapping genes in the Daping and TCGA DEG lists
Table 4 patients
Table 5 patients
Table 6 Correlation between HLA-DQB1 expression and clinical characteristics in the Daping and TCGA validation sets
Figure 2 Correlation between HLA-DQB1 mRNA level and recurrence rate and RFS in the TCGA LUAD cohort. Notes: (A) The difference in HLA-DQB1 mRNA levels between tumor and adjacent normal tissues in LUAD (***P<0.001). (B) Recurrence rate in the HLA-DQB1 high-expression group and low-expression group. (C) Kaplan-Meier plots depicting the RFS of patients stratified by HLA-DQB1 mRNA expression in stage I LUAD in the TCGA validation set (P<0.0001, HR=0.2127, 95% CI, 0.1108–0.4081). (D) Kaplan-Meier plots depicting the RFS of patients stratified by HLA-DQB1 mRNA expression in early-stage LUAD (P=0.0008, HR=0.4012, 95% CI, 0.2574–0.6255). Abbreviations: LUAD, lung adenocarcinoma; RFS, recurrence-free survival.
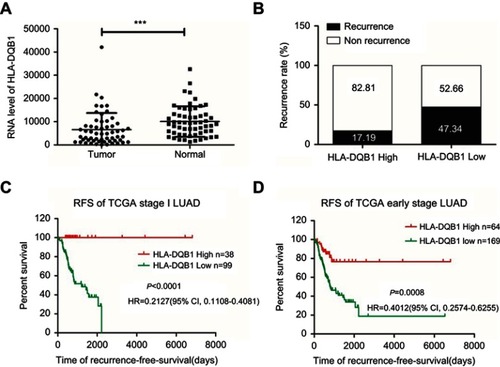
Figure 3 (A) Representative examples of HLA-DQB1 expression in tumor cells a: score 3, b: score 2, c: score 1, d: score 0 (100×). (B) Patient recurrence status in the high- and low-HLA-DQB1 expression subgroups. The recurrence rate was significantly different in the HLA-DQB1-high (34/98) and HLA-DQB1-low (46/67) subgroups (P<0.0001). (C) Kaplan-Meier plots depicting the RFS of early-stage LUAD patients stratified by tumor HLA-DQB1 staining scores. (D) Kaplan-Meier plots depicting the RFS of early-stage LUAD patients stratified by HLA-DQB1 expression level. (E) Kaplan-Meier plots depicting the RFS of stage I LUAD patients stratified by HLA-DQB1 expression level. RFS was significantly worse in patients with low levels of HLA-DQB1 expression (P<0.0001) in the Daping validation set. Abbreviations: LUAD, lung adenocarcinoma; RFS, recurrence-free survival.
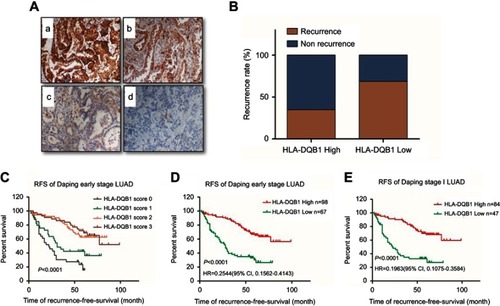
Figure 4 Correlation between HLA-DQB1 mRNA level and antitumor immune activity. Notes: Patients with high levels of HLA-DQB1 expression showed more lymphocytic infiltration in tumors (A). In addition, mRNA levels of CD4 (B), CD8 (C), GZMK (D), GZMH (E) and the immune score (F) were positively correlated with HLA-DQB1 (***P<0.001).
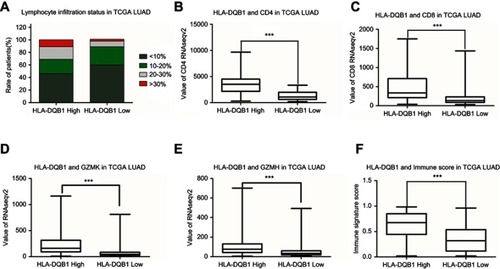
Figure 5 Correlation between HLA-DQB1 protein level and antitumor immune activity. Notes: (A) Up to 69% of LUAD patients in the high-HLA-DQB1 group had a CD4-positive T cell infiltration rate greater than 10%, with only 43% in the low-HLA-DQB1 group. (B) Approximately one-third of high-HLA-DQB1 patients had a CD8-positive T cell infiltration rate of greater than 10%, with only 8% among low-HLA-DQB1 patients. (C) Representative examples of HLA-DQB1, CD4 and CD8 staining that demonstrated more CD4- or CD8-positive T cell infiltration in tumors with high expression of HLA-DQB1 (40×). Abbreviation: LUAD, lung adenocarcinoma.
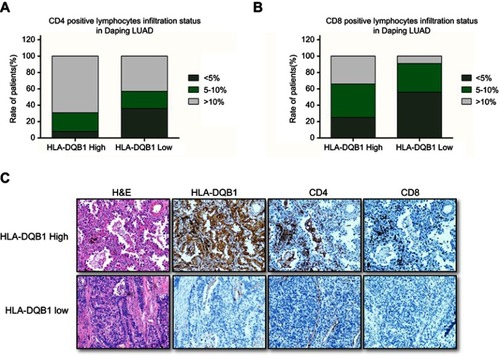
Figure S1 (A) Representative examples of interstitial cell HLA-DQB1 expression patterns (100X). a: Both tumor and interstitial cells expressed HLA-DQB1. b: Tumor cells did not express HLA-DQB1, but interstitial cells did. c: Tumor cells expressed HLA-DQB1, and interstitial cells did not. d: Neither tumor nor interstitial cells expressed HLA-DQB1. (B) Kaplan-Meier plots depicting RFS of Daping LUAD patients stratified by interstitial cell HLA-DQB1 expression. HLA-DQB1 expression in interstitial cells had no significant correlation with RFS in LUAD patients (P=0.4096). Abbreviations: LUAD, lung adenocarcinoma; RFS, recurrence-free survival.
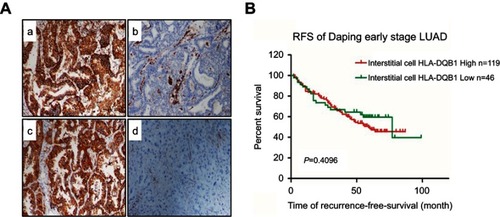
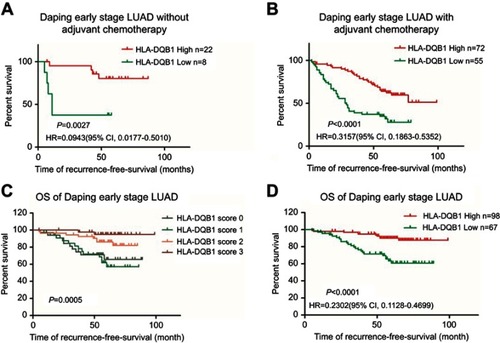
Figure S2 (A) Kaplan-Meier plots depicting RFS of early-stage LUAD patients without adjuvant chemotherapy stratified by HLA-DQB1 level (P=0.0027). (B) Kaplan-Meier plots depicting RFS of early-stage LUAD patients with adjuvant chemotherapy stratified by HLA-DQB1 level (P<0.0001). (C) Kaplan-Meier plots depicting the OS of early-stage LUAD patients stratified by tumor HLA-DQB1 staining scores (P=0.0005). (D) Kaplan-Meier plots depicting the OS of early-stage LUAD patients stratified by tumor HLA-DQB1 level (P<0.0001). Abbreviations: LUAD, lung adenocarcinoma; RFS, recurrence-free survival.