Figures & data
Figure 1 SNHG1 upregulation is a hallmark of breast cancer. (A) qRT-PCR analysis of SNHG1 expression in tumor tissues and normal tissues from breast cancer patients. (B) Histogram of SNHG1 expression. The median SNHG1 expression was used to group the patients to. (C) Survival curves of patients with low or high SNHG1 expression. N=52.
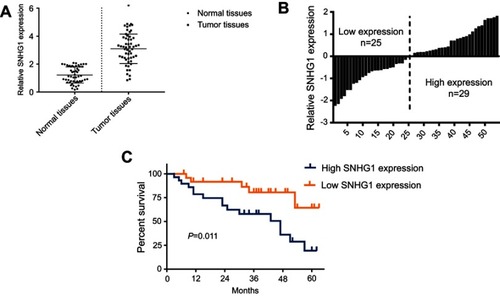
Figure 2 SNHG1 knockdown attenuates breast cancer aggressiveness in vitro. (A) qRT-PCR analysis of SNHG1 levels in breast cancer cells, including MCF-7,MDA-MB-231,ZR-75-30 and MDA-MB-453. The MCF-10a cells, which do not form tumor in vivo, were used as controls. (B) SNHG1 knockdown assay using three siRNAs specific to SNHG1. CCK-8 proliferation assay (C), colony forming assay (D), scratch wound assay (E) and transwell assay (F) for evaluating the effects of SNHG1 knockdown on the proliferation, colony formation, migration and invasion of MCF-7 and MDA-MB-231, respectively. (G) Western blot of EMT markers, including E-cadherin, N-cadherin, vimentin, and ZEB1 in MCF-7 and MDA-MB-231 cells with or without SNHG1 knockdown. N=6. *p<0.05.
Abbreviations: CCK-8, Cell Counting Kit-8; Si-NC scramble siRNA; Si-SNHG1 siRNA specifically targeting SNHG1; Si-SNHG2 siRNA specifically targeting SNHG2; Si-SNHG3 siRNA specifically targeting SNHG3.
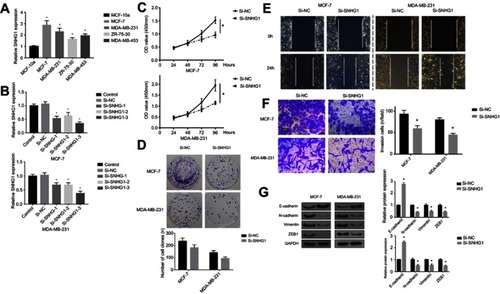
Figure 3 miR-382 is a target of SNHG1. (A) Bioinformatical analysis of the target of SNHG1, showing that a binding site exists between miR-382 and the wild-type SNHG1 but not mutant SNHG1. (B) Luciferase assay showing the decrease in SNHG1 WT activity after miR-382 mimic transfection, while no significant changes in mutant SNHG1 activity can be induced by miR-382 mimic transfection. (C) qRT-PCR analysis for SNHG1 levels in MCF-7 and MDA-MB-231 cells transfected with miR-382 mimic or inhibitor. The non-transfected cells were used as controls. (D) qRT-PCR analysis of miR-382 levels in cells transfected with si-SNHG1 or si-NC. N=6. *p<0.05.
Abbreviations: Si-NC, scramble siRNA; Si-SNHG1 WT, siRNA specifically targeting SNHG1 wild-type.
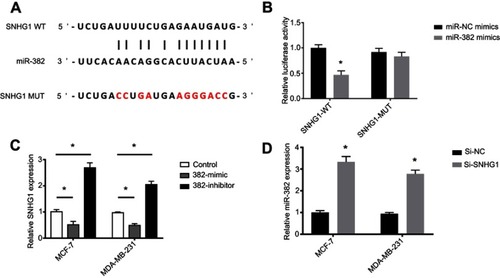
Figure 4 miR-382 mediates the regulation of breast cancer aggressiveness by SNHG1. CCK-8 proliferation assay (A), colony forming assay (B), scratch wound assay (C), and transwell assay (D) for evaluation of miR-382 overexpression or inhibition and SNHG1 overexpression of inhibition on cell proliferation, colony formation, migration and invasion, respectively. (E) Western blot assay of changes in EMT markers in MCF-7 and MDA-MB-231 cells with miR-382 overexpression/inhibition or SNHG1 overexpression/inhibition. The levels of GAPDH were used as loading controls. N=6. *p<0.05.
Abbreviations: CCK-8, Cell Counting Kit-8; EMT, epithelial-to-mesenchymal transition; Si-NC, scramble siRNA; Si-SNHG1, siRNA specifically targeting SNHG1.
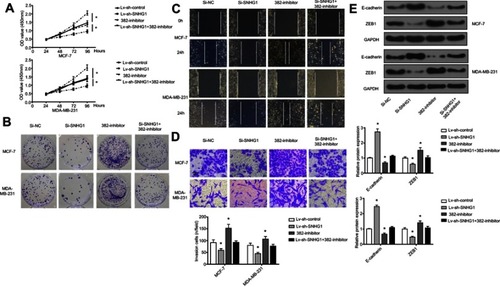
Figure 5 SNHG1 knockdown attenuates breast tumor growth in vivo. (A). Photograph and growth curves of tumors harvested from Lv-sh-control and Lv-sh-SNHG1 groups. (B) IHC of Ki67 in tumors. (C) qRT-PCR of SNHG1 levels in tumors. (D) qRT-PCR analysis of miR-382 levels in tumors. (E) Western blot of ZEB1 expression in tumors. GAPDH levels were used as loading controls. N=6. *p<0.05.
Abbreviation: Si-NC, scramble siRNA.
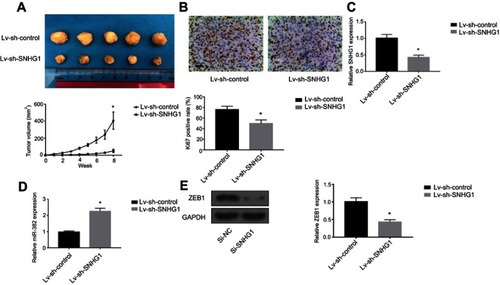
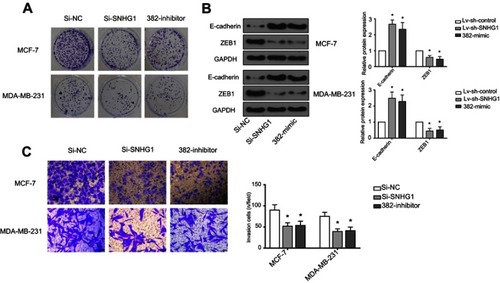
Figure S1 miR-382-mimic and Si-SNHG1 have similar effects. (A) Cell colon result, Si-NC normal, SI-SNHG1 decreases obviously, 382-mimic decreases obviously. (B) Western analysis, expression of E-cadherin and ZEB1 decreases obviously, control group is GAPDH. (C) Transwell analysis, Si-NC normal, SI-SNHG1 decreases obviously, 382-mimic decreases obviously. *p<0.05.
Abbreviations: Si-NC, scramble siRNA; Si-SNHG1, siRNA specifically targeting SNHG1.