
Figures & data
Figure 1 Flowchart of the study.
Abbreviation: CII, Colon Inflammatory Index.
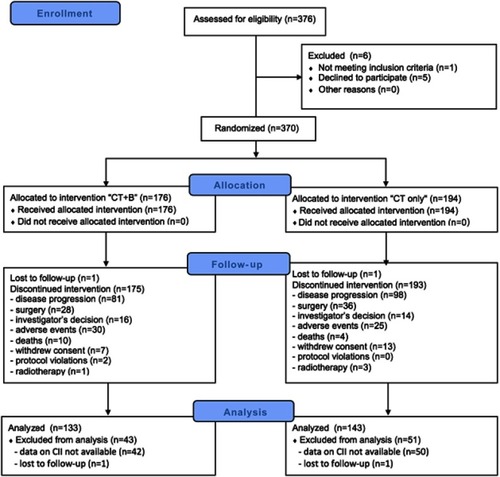
Table 1 Baseline characteristics according to CII. Good (0 factor: NLR<3 e LDH≤UNL); intermediate (1 factor: NLR≥3 o LDH>UNL); poor (2 factors: NLR≥3 e LDH>UNL)
Figure 2 Kaplan–Meier curves of progression free survival (PFS) (A) and overall survival (OS) (B) of patients for the Colon Inflammatory Index.
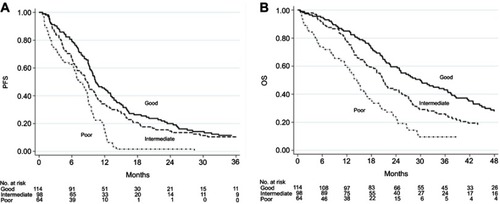
Table 2 Association between Colon Inflammatory Index and toxicity
Table 3 Prognostic/predictive value of the Colon Inflammatory Index in the total population (overall) and in CT plus B and CT-only treatment arms
Table 4 Association between the Colon Inflammatory Index and response
Figure 3 Kaplan–Meier curves of PFS (A) and OS (B) for the Colon Inflammatory Index patients treated with CT +B. Abbreviations: CT, chemotherapy; B, bevacizumab.
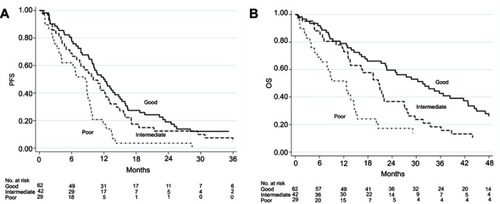
Figure 4 Kaplan–Meier curves of progression free survival (PFS) (A) and overall survival (OS) (B) for Colon Inflammatory Index in patients treated with chemotherapy alone.
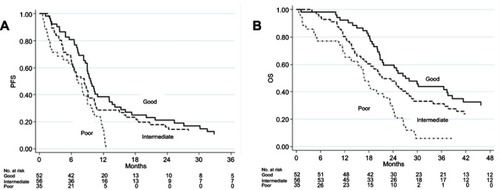
Table 5 Colon Inflammatory Index in relation to tumor localization in the overall/total population
Table 6 Colon Inflammatory Index in relation to tumor localization in the overall/total population
Table S1 Patient characteristics (N=276)