Figures & data
Table 1 Baseline clinical and characteristics of patients
Table 2 Univariable and multivariable analysis for OS
Figure 1 Cox regression forest plot of independent prognostic factors in NSCLC patients with chronic HBV infection.
Abbreviations: HBV, hepatitis B viral; GPS, Glasgow Prognostic Score; NSCLC, non-small cell lung cancer.
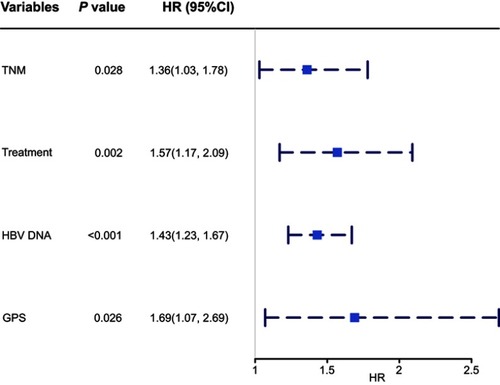
Figure 2 Kaplan–Meier estimates of 1-, 3-, and 5-year survival and OS for NSCLC patients with different HBV DNA levels. (A) 1-year survival; (B) 3-year survival; (C) 5-year survival; (D) OS for NSCLC patients.Abbreviations: HBV, hepatitis B viral; NSCLC, non-small cell lung cancer; OS, overall survival.
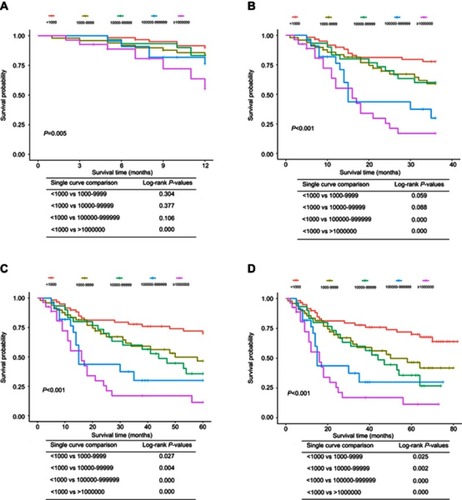
Figure 3 Nomogram model predicting 1-, 3- and 5-year survival in NSCLC patients with chronic HBV infection. Abbreviations: GPS, Glasgow Prognostic Score; HBV, hepatitis B viral; NSCLC, non-small cell lung cancer; Rad/che, radiotherapy/chemotherapy.
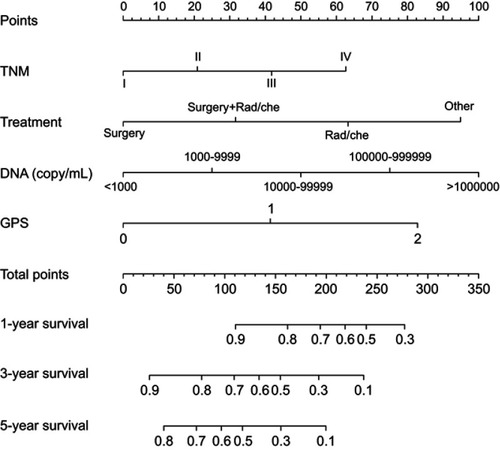
Table 3 The C-index of independent factors and nomogram for prediction of OS*
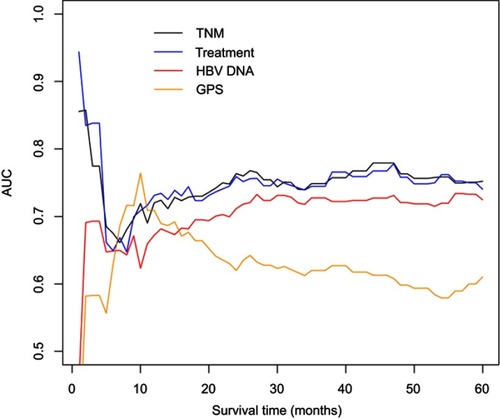
Figure 4 Time-dependent ROC analysis of TNM, treatment, HBV DNA, and GPS. Abbreviations: AUC, area under the curve; GPS, Glasgow Prognostic Score; HBV, hepatitis B viral; ROC, receiver operating characteristic.