
Figures & data
Figure 1 miR-107 expression in gastric cancer cells, exosomes, and serum of gastric cancer patients.
Notes: (A) Gastric TDEs under a transmission electron microscope. The size of TDEs ranges from 30–100 nm (images are at ×20,000). (B) Detection of exosomal surface markers CD9 and CD63 by Western blot in normal gastric epithelial cell, gastric cancer cell lines, and patient serum. (C) Increased miR-107 levels in gastric cancer cell lines and their TDEs. (a) Relative miR-107 expression in gastric cancer cell lines MGC-803, BGC-823, and SGC-7901 cells, normalized to that in the normal gastric epithelial GES-1 cell. (b) Relative miR-107 expression in TDEs, normalized to that in the GES-1-secreted exosomes. The data are presented as mean ± SD (n=6). (D) Increased miRNA-107 levels in serum from gastric cancer patients and healthy donors. miR-107 expression was determined by real-time quantitative PCR. The data are presented as mean ± SD (n=16). *P<0.05; **P<0.01.
Abbreviations: GC, gastric cancer; HD, healthy donor.
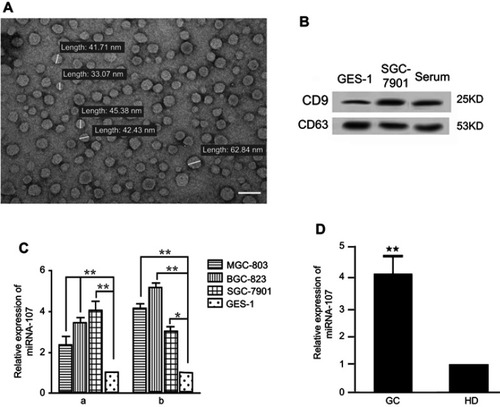
Figure 2 miR-107 delivery into HLA-DR−CD33+MDSCs via TDEs secreted by gastric cancer cells.
Notes: HLA-DR−CD33+MDSCs were incubated with TDEs containing Cy3-labeled miR-107 for 6 hrs prior to examination for miR-107 internalization. Shown here are Wright stained image, magnification × 400, (A), CFSE proliferation dye, magnification × 100 (B, Cy3-miR-107 , magnification × 400 (C), and a merged image of CFSE and Cy3, magnification × 100 (D) showing internalization of miR-107 into proliferating HLA-DR−CD33+MDSCs. (E) HLA-DR−CD33+MDSCs were incubated with TDEs containing miR-107 for 24 hrs prior to collection for real-time quantitative PCR analysis. Shown here is relative expression of miR-107 and pre-miR-107 in the MDSCs. The data are presented as mean ± SD (n=6). **P<0.01.
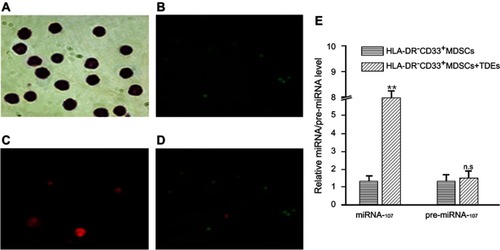
Figure 3 Sequence-specific targeting of DICER1 and PTEN 3ʹUTRs by miR-107.
Notes: (A) Software-predicted miR-107 binding sites within the 3ʹUTR of DICER1 mRNA. (B) Software-predicted miR-107 binding sites within the 3ʹUTR of PTEN mRNA. (C–D) Dual-Luciferase Reporter Assay in HEK293T cells transfected with luciferase reporter constructs as indicated, including pmiR-RB-Report™-hDICER1 (C) or pmiR-RB-Report™-hPTEN (D), together with miR-107 mimics or negative control (NC). **P<0.01.
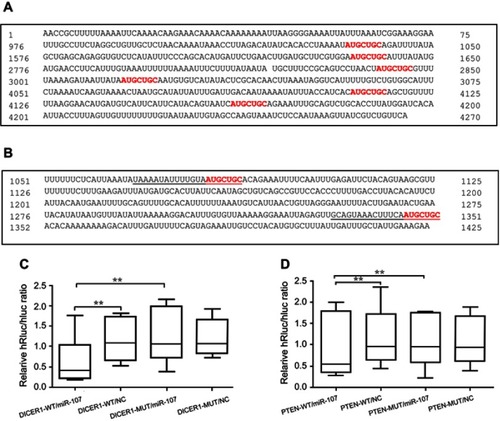
Figure 4 Down-regulation of DICER1 and PTEN in MDSC by exosomal miR-107 derived from gastric cancer cells.
Notes: (A) miR-107 mimic, inhibitor, and an unrelated control miRNA were transfected into MDSCs and miR-107 expression was determined using RT-qPCR. (B) DICER1 and PTEN mRNA expression in miR-107-transfected MDSCs. (C) DICER1 and PTEN protein expression in miR-107-transfected MDSCs. (D) Quantification of protein expression in (C). (E) DICER1 and PTEN mRNA expression in MDSCs incubated with miR-107hi or miR-107low TDEs. (F) DICER1 and PTEN protein expression in MDSCs incubated with miR-107hi or miR-107low TDEs. (G) Quantification of protein expression in (F). *P<0.05; **P<0.01.
Abbreviations: n.s., not significant; RT-qPCR, real-time quantitative PCR.
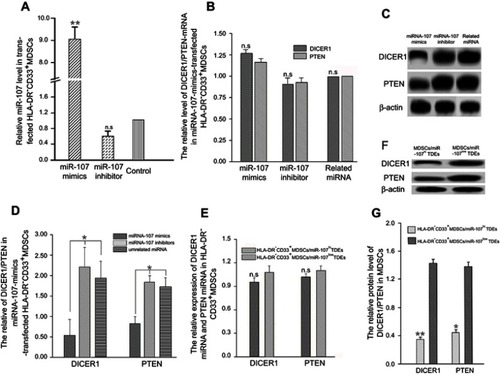
Figure 5 Expansion of HLA-DR−CD33+MDSCs induced by exosomal miR-107-mediated DICER1 suppression.
Notes: (A) miR-107 mimic, inhibitor, or an unrelated control miRNA were transfected into MDSCs, and miR-107 expression was determined using RT-qPCR. Data are presented as mean ± SD (n=6). (B) Number of MDSCs was determined at 3, 24, 48, 72 and 96 hrs after transfection with miR-107 mimic, inhibitor, or unrelated miRNA. Data were normalized to the MDSCs amount at 3 hrs. (C) miR-107 expression in MDSCs incubated for 96 hrs with miR-107hi, miR-107low TDEs or control TDEs from SGC-7901. (D) Relative number of MDSCs incubated with miR-107hi, miR-107low TDEs or control TDEs from SGC-7901. (E) WT or mutant DICER1 mRNA 3ʹUTR plasmids were separately transfected into HLA-DR−CD33+MDSCs with the miR-107 mimic, and DICER1 protein expression determined by Western blot. (F) Quantification of protein expression in (E). (G) Relative number of MDSCs co-transfected with miR-107 mimic and WT or mutant DICER1 mRNA 3ʹUTR plasmids. (H) DICER1 or scrambled siRNAs were transfected into MDSC, and DICER1 protein expression determined by Western blot. (I) Quantification of protein expression in (H). (J) Relative number of MDSCs transfected with DICER1 or scrambled siRNAs. *P<0.05; **P<0.01.
Abbreviations: n.s., not significant; RT-qPCR, real-time quantitative PCR.
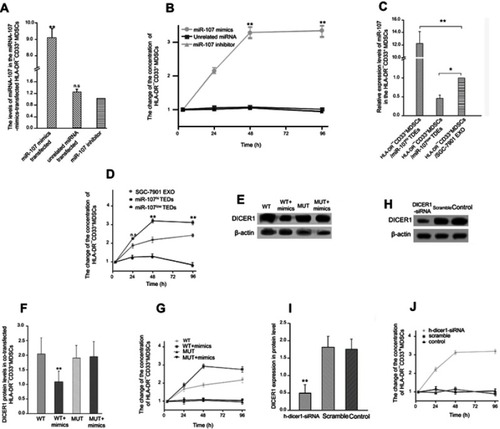
Figure 6 Exosomal miR-107 increases ARG1 expression in HLA-DR−CD33+MDSCs.
Notes: (A) miR-107 mimic, inhibitor, or an unrelated control miRNA were transfected into MDSCs, and miR-107 expression determined using RT-qPCR. (B) Relative ARG1 mRNA expression in transfected MDSCs. (C-D) Relative % of ARG1-positive cells within HLA-DR−, HLA-DR−CD11b+ or HLA-DR−CD33+MDSCs population after transfection with miR-107 mimic, inhibitor or an unrelated control miRNA. Data are presented as mean ± SD (n=6). (E) miR-107 expression in MDSCs incubated for 24 hrs with miR-107hi, miR-107low TDEs or control TDEs from SGC-7901. (F) ARG1 mRNA expression in MDSCs incubated with miR-107hi, miR-107low TDEs or control TDEs. (G–H) Relative % of ARG1-positive cells within HLA-DR−, HLA-DR−CD11b+ or HLA-DR−CD33+MDSCs population after transfection with miR-107hi, miR-107low TDEs or control TDEs from SGC-7901. Data are presented as mean ± SD (n=6). *P<0.05; **P<0.01.
Abbreviation: RT-qPCR, real-time quantitative PCR.
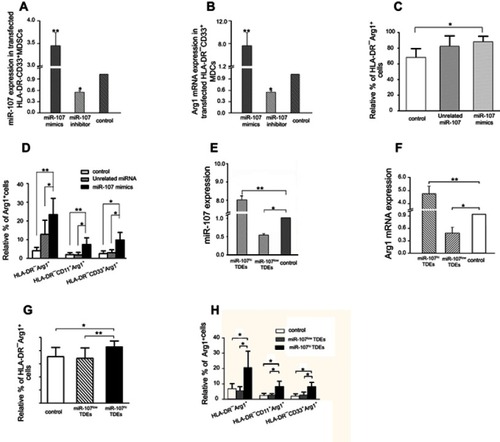
Figure 7 Increased ARG1 expression in HLA-DR−CD33+MDSCs induced by exosomal miR-107-mediated PTEN suppression and PI3K pathway activation.
Notes: (A) MDSCs were co-transfected with WT PTEN-3ʹUTR or mutant PTEN-3ʹUTR together with miR-107 mimic. PTEN protein expression was then determined by Western blot. (B) ARG1 mRNA expression in co-transfected MDSCs determined by RT-qPCR. (C) Relative % of ARG1-positive cells within HLA-DR−, HLA-DR−CD11b+ or HLA-DR−CD33+MDSC population determined by flow cytometry after co-transfection with WT or mutant PTEN-3ʹUTR and miR-107 mimic. (D) mRNA expression of PI3K, AKT, mTOR, and NF-kB in co-transfected MDSCs. (E) PI3K, AKT, mTOR, NF-kB, p-AKT, p-mTOR and p65 subunit of NF-kB protein expression was determined by Western blot. (F) Quantification of protein expression in (E). (G) PTEN or scrambled siRNAs were transfected into the MDSCs, and PTEN protein expression was determined by Western blot. (H) Quantification of protein expression in (G). (I) Relative ARG1 mRNA expression in MDSCs transfected with PTEN or scrambled siRNAs. (J–K) Relative % of ARG1-positive cells within HLA-DR−, HLA-DR−CD11b+ or HLA-DR−CD33+MDSC population after transfection with PTEN or scrambled siRNAs. (L) mRNA expression of PI3K, AKT, mTOR and NF-kB in MDSCs transfected with PTEN or scrambled siRNAs. (M) PI3K, AKT, mTOR, NF-kB, p-AKT, p-mTOR and p65 subunit of NF-kB protein expression in MDSCs transfected with PTEN or scrambled siRNAs. (N) Quantification of protein expression in (M). *P<0.05; **P<0.01.
Abbreviations: n.s., not significant; RT-qPCR, real-time quantitative PCR.
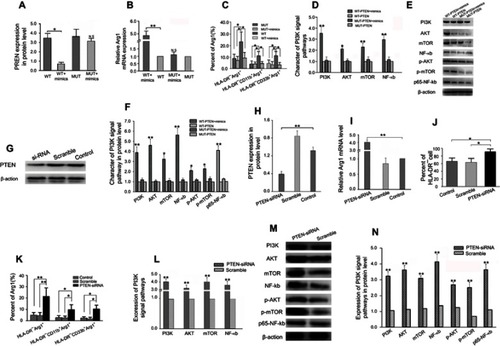
Figure 8 Exosomal miR-107 induces mouse CD11b+Gr1+/highMDSCs expansion in vivo.
Notes: (A–C)magnification × 100 SGC-7901-secreted TDEs containing Cy3-labeled miR-107 mimic was injected intravenously into tail veins of mice. After 72 hrs, CD11b+Gr1+/highMDSCs were collected and labeled with CFSE proliferation dye (A). Also shown are MDSCs labeled by Cy3-labeled miR-107 mimic (B), and a merged image of (A) and (B). (D) Flow cytometry analyses of MDSCs from mice injected with normal saline (NS), TDEs from parental SGC-7901 cells (SGC-7901-EXO), those transfected with miR-107 inhibitor (INH-EXO), exosomes from healthy volunteer serums (HDS-EXO) and TDEs from gastric cancer patient serums (PS-EXO), showing the percentage of CD11b+Gr1+/high and CD11b+Gr1−/low populations of cells within each group. (E) Quantification of flow cytometry data in (D). (F) mRNA expression of ARG1, NOS2, DICER1 and PTEN in MDSCs isolated from exosome-injected mice. (G) Western blot showing relative protein expression of ARG1, NOS2, DICER1 and PTEN in MDSCs isolated from exosome-injected mice. (H) Quantification of protein expression in (G). *P<0.05; **P<0.01.
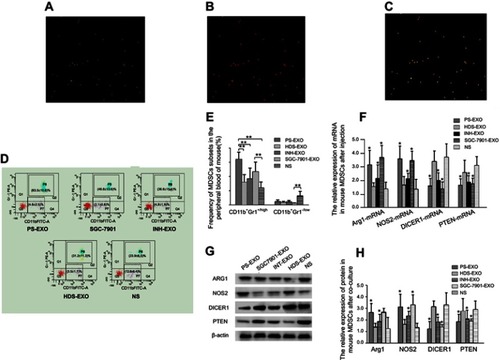
Table S1 The primers for detecting all the mRNAs