
Figures & data
Table 1 Clinicopathological features of the 201 CRC patients
Figure 1 TfR1 expression in CRC tissues. (A) TfR1 mRNA expression in 19 pairs of primary colorectal cancer tissues and paired noncancerous tissues was assessed by real-time PCR. Relative TfR1 mRNA expression was notably higher in tumor tissues than in noncancerous tissues (P=0.015). T denotes colorectal tumor tissues and N denotes colorectal normal tissues. (B) Representative images of TfR1 expression in CRC tissues (T) and noncancerous tissues (N). TfR1 protein was predominantly localized in the cytoplasm (magnification: left, 40×; right, 100×). (C) Correlation of TfR1 expression with clinicopathological features of the 201 CRC patients. TfR1 expression in CRC tissues was obviously higher in CRC patients with well differentiation, no lymph node metastasis, no distant metastasis, no vascular invasion and early TNM stage, *P<0.05, **P<0.01, ***P<0.001. (D) CRC patients with positive TfR1 expression had a better postoperation survival than those with negative TfR1 expression, P=0.044. (E) The survival curve of TfR1 in LinkedOmics database shows that CRC patients with TfR1-positive expression have a better survival than those with TfR1-negative expression, though there is no statistical significance (P=0.18).
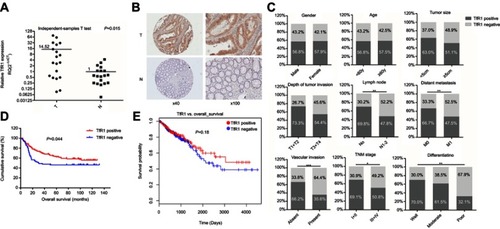
Figure 2 TfR1 expression in colorectal cancer cell lines. TfR1 mRNA expression in six CRC cell lines was examined by RT-PCR (A) and real-time PCR (B). TfR1 mRNA was relatively overexpressed in SW480 and SW620 cell lines, while RKO and LoVo cell lines had comparatively lower expression levels. (C) Differential TfR1 protein expression in the six CRC cell lines was evaluated by Western blot. The TfR1 protein expression levels in these cell lines were consistent with mRNA expression.
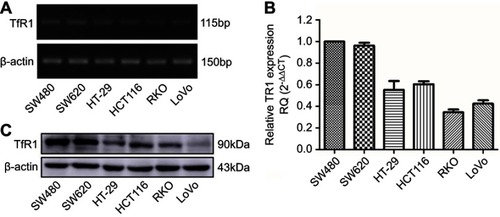
Figure 3 TfR1 expression was downregulated by lentivirus-mediated shRNA. TfR1 mRNA expression was verified by real-time PCR, showing that TfR1 expression in Lenti-shTfR1 cells was significantly lower than in control cells in both SW480 (A) and SW620 (B) cell lines, ***P<0.001. (C) The downregulation of TfR1 protein expression was assessed by Western blot.
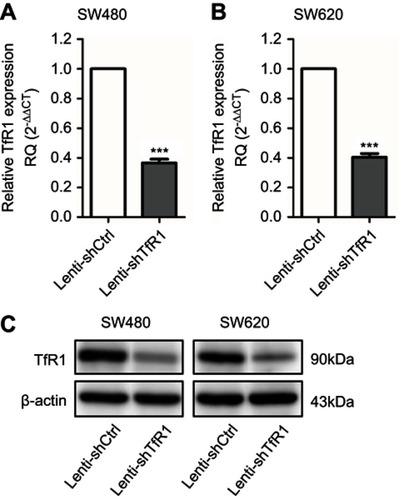
Figure 4 Downregulation of TfR1 inhibited proliferation of CRC cells. Cell proliferation was determined by CCK-8, and results showed that downregulation of TfR1 inhibited CRC cell proliferation significantly in both SW480 (A) and SW620 (B) cell lines, ***P<0.001. Knockdown of TfR1 expression decreased colony formation, with 42±12 colonies in Lenti-shTfR1 vs 129±50 colonies in control cells in SW480 (C and D), and 4±3 colonies in Lenti-shTfR1 vs 43±23 colonies in control cells in SW620 (C and E), *P<0.05.
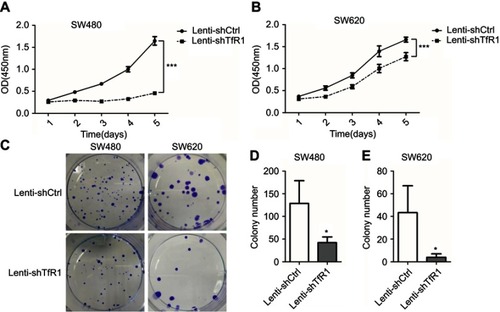
Figure 5 Successful rescue of TfR1 expression was confirmed after using TfR1 overexpression lentivirus in Lenti-shTfR1 cells. Rescue of TfR1 overexpression was confirmed by real-time PCR demonstrating that there was a significant overexpression of TfR1 in shTfR1-Lenti-TfR1 cells compared with control cells, in SW480 (A) and SW620 (B), ***P<0.001. (C) TfR1 protein expression was also higher in shTfR1-Lenti-TfR1 cells, evaluated by Western blot. At the same time, there was a significantly faster growth rate in shTfR1-Lenti-TfR1 cells compared with shTfR1-Lenti-Ctrl cells in SW480 (D) and SW620 (E), ***P<0.001.
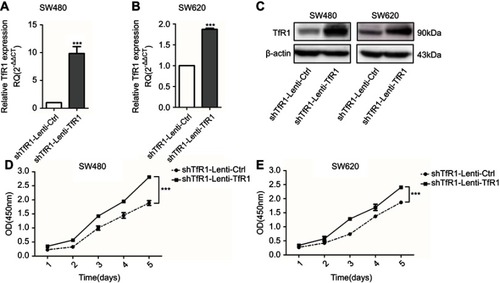
Figure 6 TfR1 knockdown changed cell cycle and promoted cells from G1 phase to S phase. (A) Cell cycle analysis showed that there was decrease of G1 phase and increase of S phase in Lenti-shTfR1 cells compared with control cells. (B) In SW480, G1 phase significantly decreased from 52.68±0.97% in control cells to 41.02±3.56% in Lenti-shTfR1 cells (***P<0.001) and S phase increased significantly from 29.42±1.99% in control cells to 35.79±4.31% in Lenti-shTfR1 cells (##P<0.01). (C) In SW620, G1 phase decreased significantly from 55.86±9.48% in control cells to 42.63±8.96% in Lenti-shTfR1 cells (**P<0.01), and S phase increased significantly from 33.12±8.19% in control cells to 42.00±7.20% in Lenti-shTfR1 cells (#P<0.05). (D) The expression of G1/S transition proteins (CDK2, CDK4, CDK6 and Cyclin D1) and G2 phase protein phospho-cdc2 was analyzed by Western blot. Knockdown of TfR1 expression resulted in upregulation of CDK2, CDK4, CDK6 and Cyclin D1 but downregulation of phospho-cdc2.
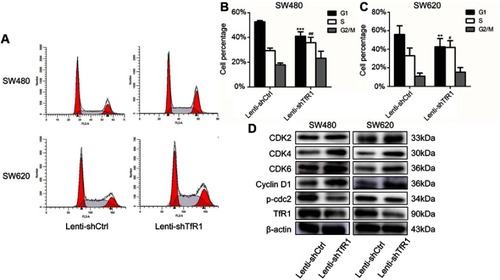
Figure 7 TfR1 downregulation promoted migration and invasion of CRC cells. (A) In SW480, the number of migration cells per field was 908±113 in TfR1 knockdown cells vs 480±18 in control cells, and the number of invasion cells per field was 632±23 in TfR1 knockdown cells vs 331±84 in control cells (**P<0.01). (B) In SW620, the number of migration cells per field was 656±17 in TfR1 knockdown cells vs 290±34 in control cells (**P<0.01), and the number of invasion cells per field was 472±16 in TfR1 knockdown cells vs 165±26 in control cells (***P<0.001).
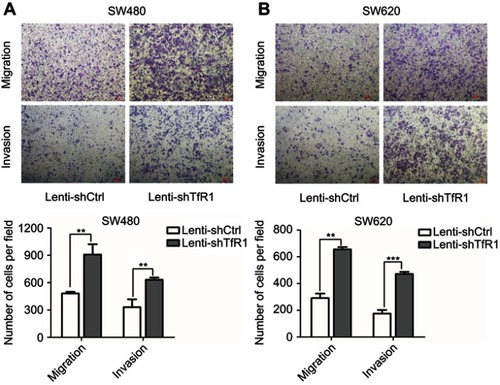
Figure 8 Migration and invasion abilities of TfR1-negative CRC cells were stronger than TfR1-positive cells. (A) In LoVo, the number of migration cells per field was 1642±118 in TfR1-negative cells vs 906±60 in TfR1-positive cells, and the number of invasion cells per field was 1293±39 in TfR1-negative cells vs 579±89 in TfR1-positive cells (**P<0.01). (B) In RKO, the number of migration cells per field was 905±44 in TfR1-negative cells vs 492±56 cells in TfR1-positive cells (**P<0.01), and the number of invasion cells per field was 365±24 in TfR1-negative cells vs 153±18 in TfR1-positive cells (***P<0.001).
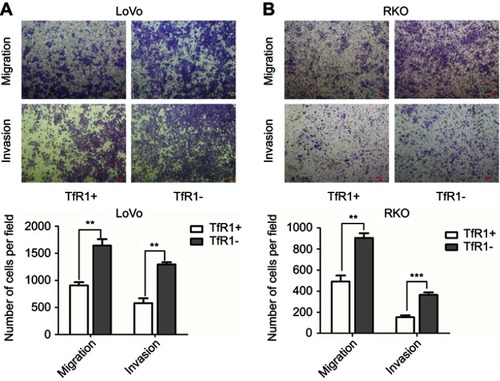
Figure 9 The JAK/STAT signaling pathway was activated after TfR1 downregulation. (A) p-Jak1 and p-Tyk2 in the JAK family were upregulated in Lenti-shTfR1 cells compared with control cells. Expression of p-Jak2 or p-Jak3 was not detected. (B) In the STAT family, p-STAT1, p-STAT3(Ser727), p-STAT5 and p-STAT6 were upregulated in Lenti-shTfR1 cells and there was a more distinct upregulation of p-STAT3(Ser727) than p-STAT3(Tyr705).
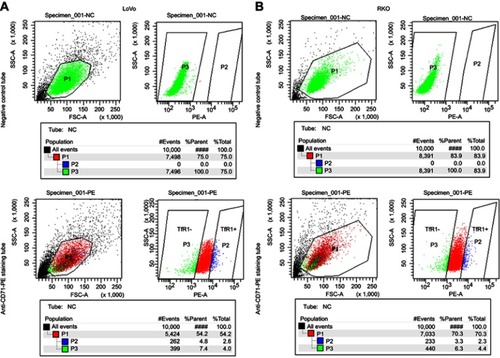
Figure 10 Downregulation of TfR1 expression reduced in vivo carcinogenesis. (A) Tumors from Lenti-shTfR1 SW620 cells (lower row) were smaller than tumors from Lenti-shCtrl SW620 cells (upper row). (B) In SW620, tumors from Lenti-shTfR1 cells had a slower growth rate than tumors from Lenti-shCtrl cells (*P<0.05). (C) Weight of tumors from Lenti-shTfR1 cells was lower than from control cells, with 0.63±0.12 g of Lenti-shTfR1 vs 0.98±0.23 g of Lenti-shCtrl (*P<0.05).
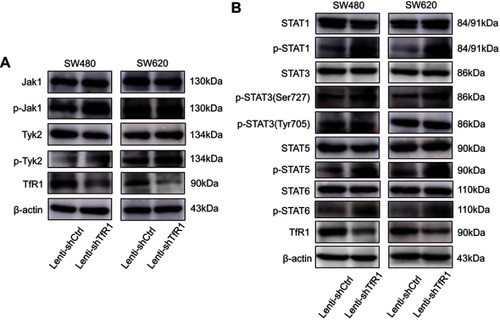
Figure S1 The cell sorting plot for flow cytometry sorting. The negative control tubes were null cells without any staining, which were used for determination of TfR1-negative plot (green). The rightmost cell population in staining tubes were chosen as TfR1-positive plot (blue). (A) is the sorting plot for LoVo and (B) is for RKO.
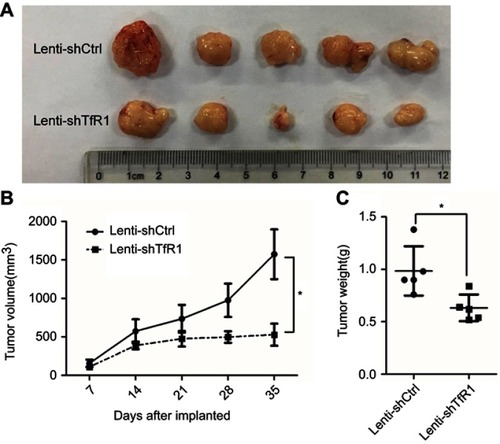
Figure S2 The result of protein microarray analysis. Both in SW480 (A) and SW620 (B), there was a consistent upregulation of phospho-STAT3(Ser727) in Lenti-shTfR1 cells (marked by the red frame) compared with control cells.
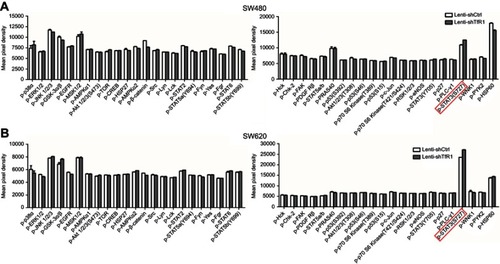
Figure S3 In vivo carcinogenesis of SW480. As for SW480 cells, tumors from Lenti-shTfR1 cells had a slower growth rate (A, P=0.12) and lighter tumor weight (B, P=0.29) than control cells, even if there was no statistical significance.
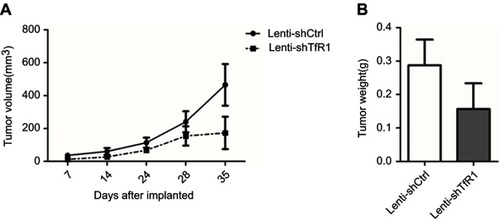
Table 2 Correlation between TfR1 expression and clinicopathological features of the 201 CRC patients
Table S1 The sequences of primers
Table S2 The information of antibodies