Figures & data
Table 1 Clinical pathologic characteristics of the 20 breast cancer patients
Figure 1 Upregulation of TM4SF1 and downregulation of miR-206 in clinical breast cancer tissues compared with the levels in adjacent normal breast tissues.
Notes: The mRNA expression of TM4SF1 (A) and miR-206 (B) was detected by real-time PCR in four subtypes of clinical breast cancer (Luminal A, Luminal B, Her2+, and basal like. N=5 for each subtype). (C) Western blotting analysis of TM4SF1 expression in four subtypes of clinical breast cancer. β-Actin served as the internal control. (D) The relative fold change of TM4SF1/β-actin in (C) was detected by imageJ software. *P<0.05; **P<0.01; ***P<0.001.
Abbreviations: TM4SF1, transmembrane 4 L6 family member 1; miR-206, microRNA-206.
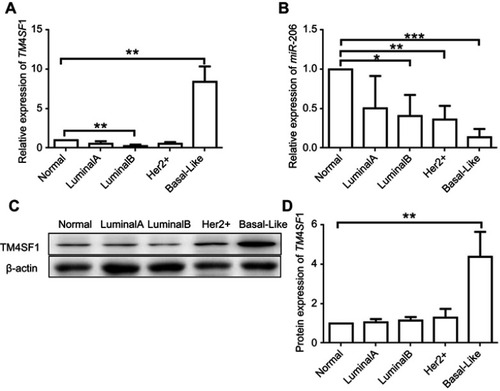
Figure 2 miR-206 negatively regulated gene expression of TM4SF1 in MDA-MB-231 cells.
Notes: (A) MDA-MB-231 cells were transfected with 100 nM miR-206, anti-miR-206, or NC for 24 hrs. The mRNA expression of TM4SF1 was detected by real-time PCR. (B) Western blotting analysis of TM4SF1 expression in (A). β-Actin served as the internal control. (C) The relative fold change of TM4SF1/β-actin in (B) was detected by imageJ software. *P<0.05; **P<0.01.
Abbreviations: TM4SF1, transmembrane 4 L6 family member 1; NC, negative control; miR-206, microRNA-206.
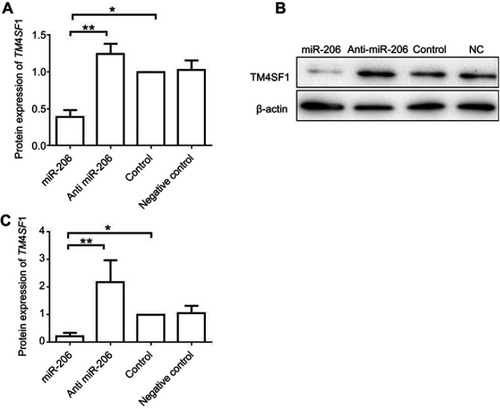
Figure 3 Generation of TM4SF1-knockout MDA-MB-231 cells.
Notes: (A) Sanger sequencing of TM4SF1 gene in the knockout MDA-MB-231 cells. Two bases of nucleic acid were deleted of coding sequence resulting in frameshift mutation. (B) The mRNA expression of TM4SF1 was detected by real-time PCR in the knockout MDA-MB-231 cells. (C) Western blotting analysis of TM4SF1 expression in (B). β-actin served as the internal control. (D) Immunostaining of TM4SF1 in the knockout MDA-MB-231 cells. DAPI was used to stain nuclei. ***P<0.001.
Abbreviations: TM4SF1, transmembrane 4 L6 family member 1; KO, knockout; DAPI, 4′,6-diamidino-2-phenylindole.
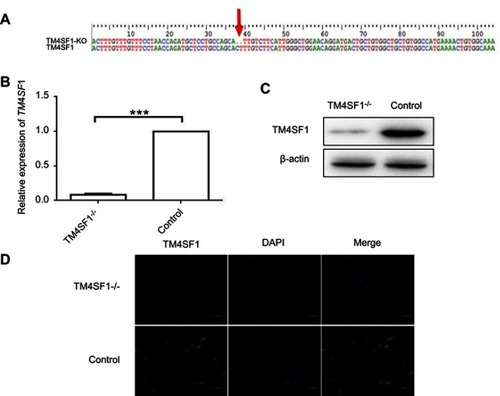
Figure 4 TM4SF1 knockout had no effect on cell viability and cycle in MDA-MB-231 cells.
Notes: (A) MTT cell viability assays were performed using parental MDA-MB-231 cells or TM4SF1 KO MDA-MB-231 cells at the indicated time points. (B) Cell cycle was determined by propidium iodide staining and detected by flow cytometry.
Abbreviations: TM4SF1, transmembrane 4 L6 family member 1; -/-, TM4SF1-knockout MDA-MB-231 cells; PI, propidium iodide.
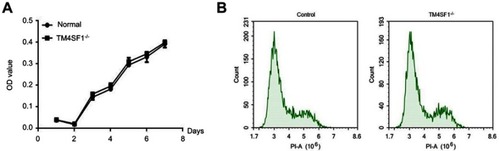
Figure 5 TM4SF1 KO MDA-MB-231 cells displayed reduced cell migration and invasion capabilities in vitro.
Notes: (A) Migration activity of TM4SF1 KO MDA-MB-231 cells or KO MDA-MB-231 cells transfected with miR-206 was measured by transwell assay. (B) Relative transmitted cell numbers in the transwell assay in (A). **P<0.01.
Abbreviations: TM4SF1, transmembrane 4 L6 family member 1; miR-206, microRNA-206; -/-, TM4SF1-knockout MDA-MB-231 cells.
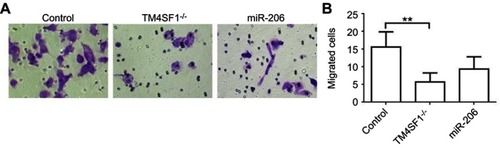
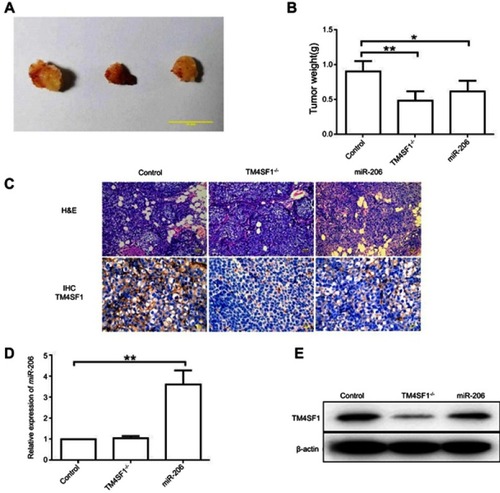
Figure 6 TM4SF1-KO MDA-MB-231 cells displayed a reduced tumor burden in BALB/c nude mice.
Notes: (A) Representative images of breast tumors in control group, TM4SF1-/- group, and miR-206 group (N=6). (B) Average tumor weight of control group, TM4SF1-/- group, and miR-206 group (N=6). (C) Representative pictures of H&E staining and immunohistochemistry of TM4SF1 for breast tumors in the control group, TM4SF1-/- group and miR-206 group (N=6). (D) The miR-206 amount in the tumors of control group, TM4SF1-/- group and miR-206 group (N=6) was detected by real-time PCR. (E) Western blotting analysis of TM4SF1 expression in the tumors of the control group, TM4SF1-/- group, and miR-206 group (N=6). *P<0.05; **P<0.01.
Abbreviations: TM4SF1, transmembrane 4 L6 family member 1; miR-206, microRNA-206; -/-, TM4SF1-knockout MDA-MB-231 cells.