
Figures & data
Table 1 Clinical parameters of LGG patients in TCGA (n=524)
Table 2 Clinical parameters of HGG patients in TCGA (n=523)
Table 3 Relationship between sPLA2s and patient prognosis in LGGs and HGGs from TCGA database
Figure 1 PLA2G5 gene expression was associated with the clinicopathological features of glioma patients(*P<0.05;***P<0.0001). (A) PLA2G5 gene expression was dependent on glioma WHO grade; (B) PLA2G5 gene expression was associated with the histological type of glioma; (C)-(D) PLA2G5 gene expression was positively correlated with patient age in LGGs (P<0.0001) but not in HGGs (P=0.0767); (E)-(F) PLA2G5 gene expression was associated with radiotherapy of HGGs (P=0.0169), but not with chemotherapy (P=0.2771).
Abbreviations: TCGA, the Cancer Genome Atlas; LGG, low-grade glioma; HGG, high-grade glioma; GBM, glioblastoma.
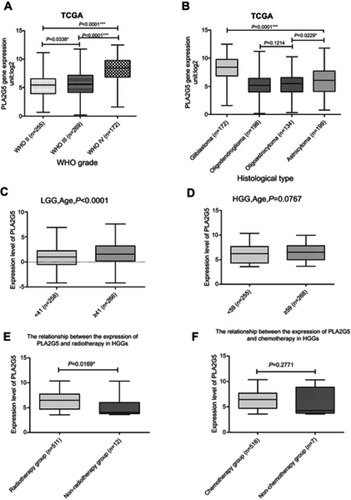
Figure 2 PLA2G5 protein expression in glioma examined by immunohistochemistry. (A)-(D) Immunohistochemical staining images of grade II, III and IV glioma tissues and non-tumor brain tissues (magnification ×200 and ×400); (E) The immunohistochemical score indicates that PLA2G5 protein expression was dependent on WHO grade.
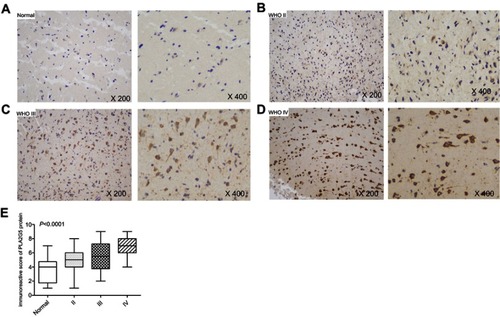
Figure 3 Kaplan-Meier survival analysis based on the median (low and high) PLA2G5 gene transcript expression in glioma. (A) High PLA2G5 gene expression indicated poor survival in LGGs (P=0.0002); (B) High PLA2G5 gene expression indicated poor survival in HGGs (P=0.002).
Abbreviations: TCGA, the Cancer Genome Atlas; LGG, low-grade glioma; HGG, high-grade glioma.
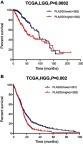
Table 4 Univariate and multivariate Cox regression analyses of PLA2G5 expression and clinicopathological features in affecting the OS of patients with LGG
Table 5 Univariate and multivariate Cox regression analyses of PLA2G5 expression and clinicopathological features in affecting the OS of patients with HGG
Figure 4 The relationship between PLA2G5 gene expression and IDH1 status and EMT markers in glioma. (A)-(B) PLA2G5 expression in IDH1 wild-type cases was higher than that in IDH1 mutant cases in both LGGs (p<0.0001) and HGGs (p<0.0001); (C) The correlation between of PLA2G5 and FN1 in HGGs; (D) The correlation between PLA2G5 and VIM in HGGs; (E) The correlation between PLA2G5 and CDH2 in HGGs.
Abbreviations: TCGA, the Cancer Genome Atlas; LGG, low-grade glioma; HGG, high-grade glioma.
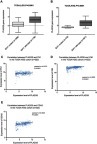
Table 6 The correlation of PLA2G5 expression with the expression of EMT markers
Figure S1 The immunohistochemical staining score of PLA2G5 in glioma and positive/negative control (magnification ×200). (A) Percentage score = 1, intensity score = 1; (B) Percentage score = 2, intensity score = 1; (C) Percentage score = 3, intensity score = 2; (D) Percentage score = 3, intensity score = 3; (E) Positive control: cardiac muscle; (F) Negative control: striated muscle.
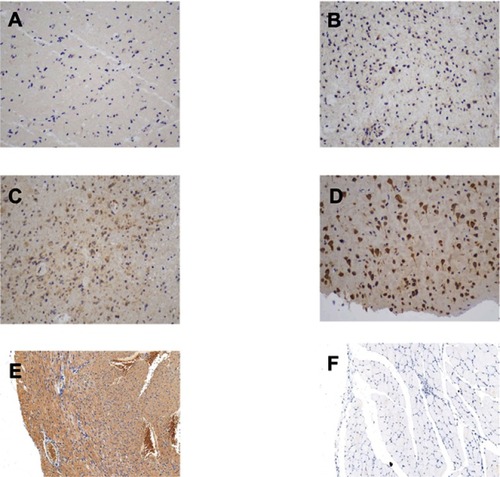
Figure S2 Representative MRI images of various glioma subtypes. (A) Glioblastoma (WHO IV); (B) Astrocytoma (WHO III); (C) Astrocytoma (WHO II); (D) Oligodendroglioma (WHO III); (E) Oligodendroglioma (WHO II); (F) Oligoastrocytoma (WHO II).
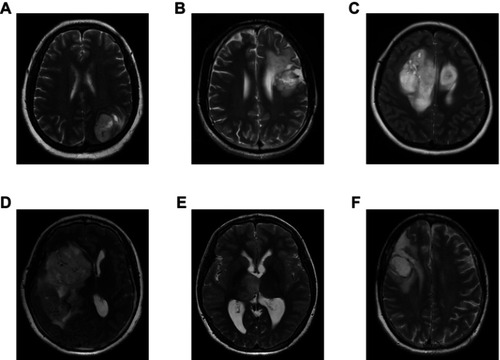
Figure S3 There was no correlation between the PLA2G5 gene expression level and gender in both LGGs (A) and HGGs (B).
Abbreviations: TCGA, the Cancer Genome Atlas; LGG, low-grade glioma; HGG, high-grade glioma.
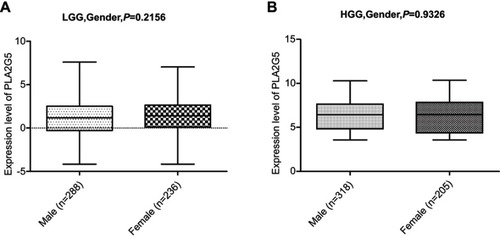
Figure S4 Patients with IDH1 mutation survived longer than those with wild-type IDH1 in both LGGs (A) and HGGs (B).
Abbreviations: TCGA, the Cancer Genome Atlas; LGG, low-grade glioma; HGG, high-grade glioma.
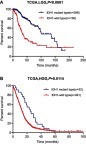
Table S1 Clinical parameters of 82 patients form the department of neurosurgery, Xiangya Hospital, Hunan, China