Figures & data
Figure 1 MiR-193a-3p expression in PDAC. (A) MiR-193a-3p expression was down-regulated in PDAC tissue in the online databases. (B) MiR-193a-3p expression in PANC-1 and BxPC-3 cells was lower than that in Hpde6-C7 cells. (C) MiR-193a-3p expression in PDAC tissues was lower than in para-carcinoma tissues. (D) Forest plot combining the GEO datasets with our qRT-PCR data showed down-regulated expression of miR-193a-3p in PDAC tissue.
Abbreviations: PDAC, pancreatic ductal adenocarcinoma; GEO, Gene Expression Omnibus.
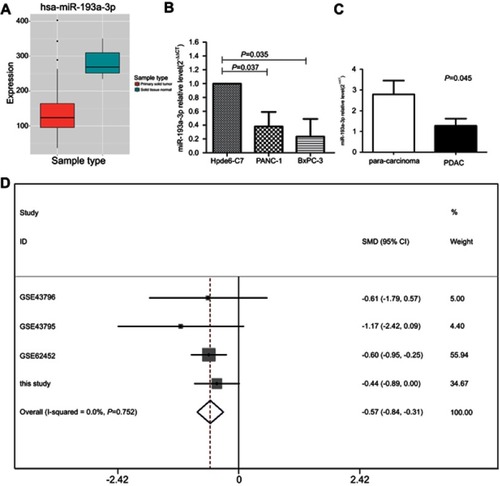
Figure 2 Effect of miR-193a-3p overexpression on PDAC cell proliferation. (A) The proliferation capacity of BxPC-3 cells was significantly decreased 3 d(P=0.001), 4 d(P=0.022), and 5 d(P=0.002) after transfection. (B) The multiplication ability of Panc-1 cells was significantly reduced 2 d(P=0.006), 3 d(P=0.001), 4 d(P=0.011), and 5 d(P=0.000) after transfection. (*P<0.05, **P<0.01, ***P<0.001).
Abbreviations: NC, negative control; OE, the overexpression of miR-193a-3p.
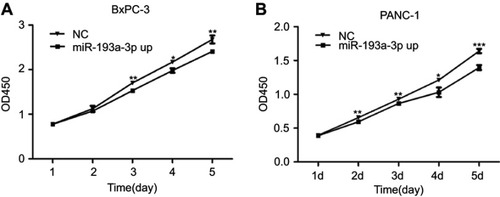
Figure 3 The cycle distribution of PDAC cells after overexpression of miR-193a-3p. (A and B) Cycle distribution of the BxPC-3 cell line and Panc-1 cell line. (C) Statistical analysis of the cell cycle distribution of PDAC.
Abbreviations: NC, negative control; OE, the overexpression of miR-193a-3p.
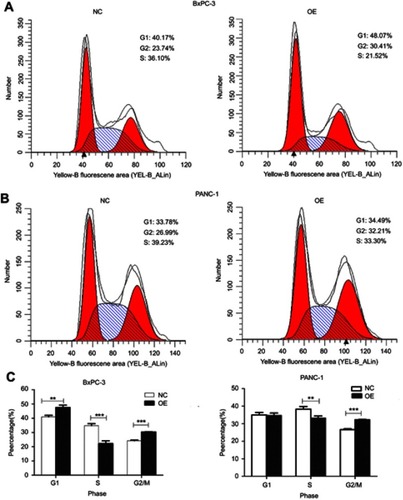
Figure 4 Effect of miR-193a-3p overexpression on the apoptosis of PDAC cells. (A) The result of detecting apoptosis after the overexpression of miR-193a-3p. (B) Apoptosis rates of the two cell lines in the experimental groups were compared with those in the negative control groups.
Abbreviations: NC, negative control; OE, the overexpression of miR-193a-3p.
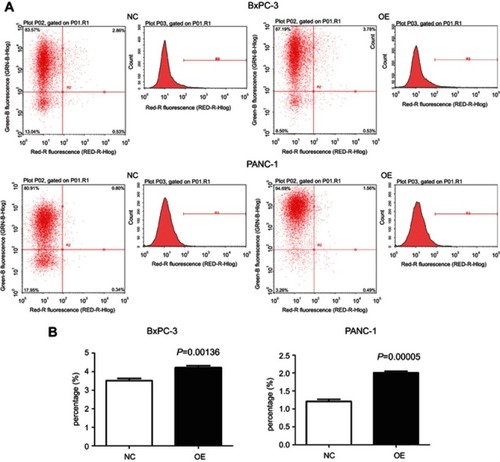
Table 1 GO analysis of miR-193a-3p target genes
Table 2 KEGG pathway analysis of miR-193a-3p target genes
Figure 5 Bubble Chart of the results of the GO and KEGG analysis. Pathway visualization of the results of the GO and KEGG analysis of the miR-193a-3p target genes, which was performed in ImageGP (https://www.ehbio.com/ImageGP/).
Abbreviations: BP, biological process; CC, cellular component; MF, molecular function; GO, gene ontology; KEGG, Kyoto Encyclopedia of Genes and Genomes.
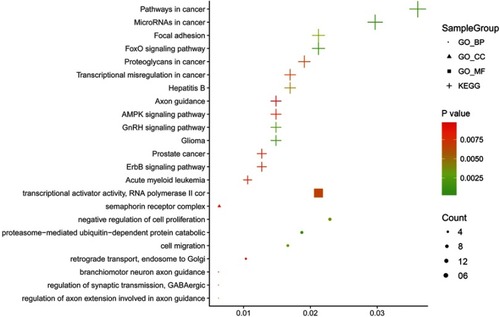
Figure 6 Protein-protein interaction network of miR-193a-3p target genes.
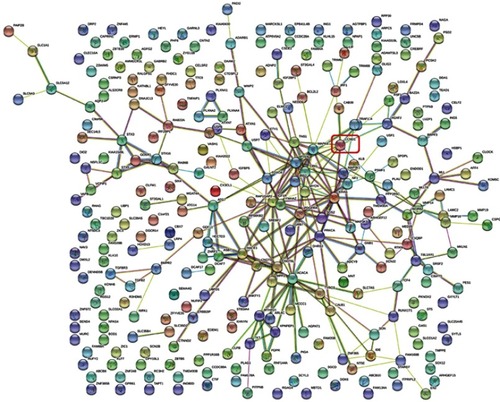
Figure 7 The expression of CCND1 in PDAC. (A) CCND1 expression in FFPE PDAC tissues and para-carcinoma tissues. (B) Forest plot for the miR-193a-3p expression in PDAC.
Abbreviation: FFPE, formalin-fixed paraffin-embedded.
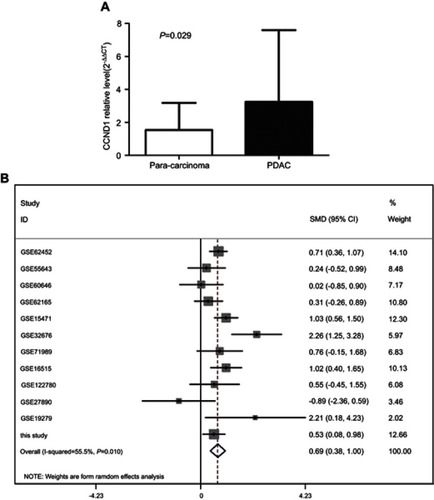
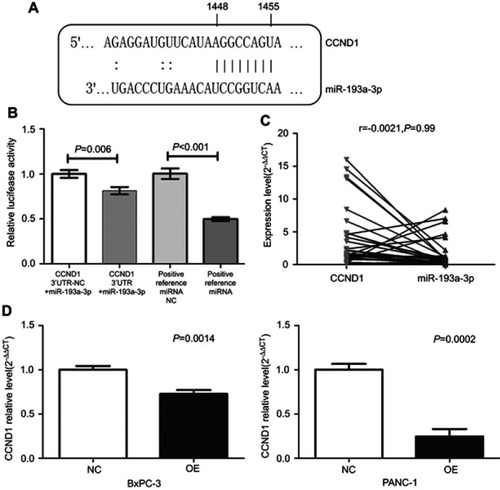
Figure 8 The relationship between miR-193a-3p and CCND1. (A) Base-complementing sequences of miR-193a-3p and CCND1. (B) Relative luciferase activity in cells with CCND1 3ʹUTR+miR-193a-3p was reduced compared to cells with CCND1 3ʹUTR-NC+miR-193a-3p. The relative luciferase activity in the group of positive reference miRNA was lower than in the group of positive reference miRNA NC. (C) Negative correlation between miR-193a-3p and CCND1 in FFPE PDAC tissue. (D) Reduced expression of CCND1 in the two cell lines after the overexpression of miR-193a-3p.
Abbreviations: NC, negative control; OE, the overexpression of miR-193a-3p; FFPE, formalin-fixed paraffin-embedded.