
Figures & data
Figure 1 Confirmation of tsRNA sequencing results by qRT-PCR in samples from 10 paired breast cancer samples. Four tsRNA were selected for the qRT-PCR analysis, including (A) tsRNA-26576, (B) tsRNA-21042, (C) tsRNA-147736, (D) tsRNA-10281. The U6 was chosen as the reference gene. All data are shown as the average value of 3 independent experiments .
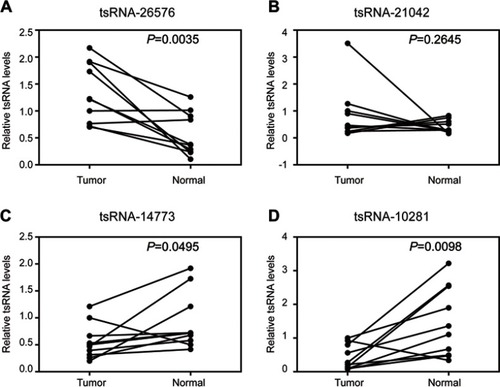
Figure 2 Scatter plot for GO term enrichment analysis and KEGG enrichment of tsRNA target genes. (A) The top 20 of GO enrichment are shown in the senior bubble chart. The size of the circle indicates the tsRNA target unigene number. Each different color indicates a different P-value used for significance verification. (B) The top 20 enrichment KEGG pathways are displayed in the senior bubble chart. Rich factors are shown as the proportion of tsRNA target gene numbers to all gene numbers that are annotated in this pathway term. The size of the circle indicates the tsRNA target unigene number. Each different color indicates a different P-value used for significance verification.
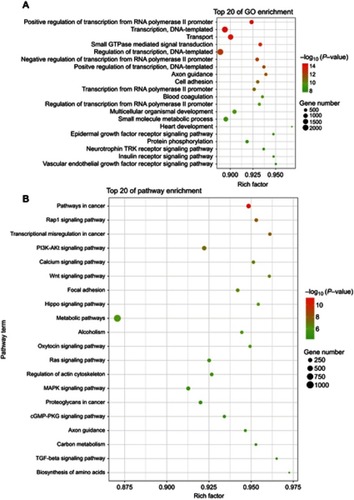
Figure 3 tsRNA-26576 could promote breast cancer cell growth, migration and invasion. (A) qRT-PCR analysis of tsRNA-26576 expression level after the treatment of tsRNA-26576 inhibitor. (B) qRT-PCR analysis of tsRNA-26576 expression level after overexpression of tsRNA-26576 mimic. (C) MDA-MB-231 cell proliferation was evaluated by the CCK-8 assay. MDA-MB-231 cell migration (D) and invasion (F) ability after knockdown of tsRNA-26576 were determined using transwell assay. MDA-MB-231 cell migration (H) and invasion (J) ability after overexpression of tsRNA-26576 were determined using transwell assay. (E, G, I, K) The number of MDA-MB-231 cells in three random microscopic fields was counted for each group. The results presented are the average value of three random microscopic fields from 3 independent experiments. All data are the mean of 3 independent experiments. Error bars indicate ± SEM.
Abbreviation: NC, normal control.
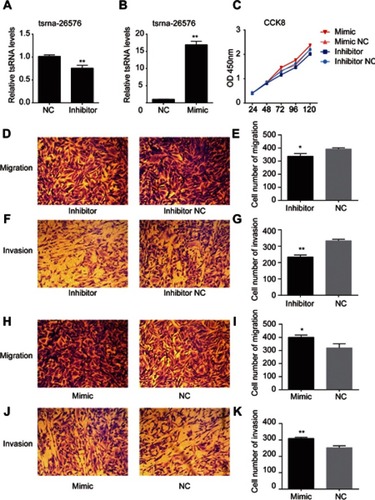
Figure 4 tsRNA-26576 could inhibit breast cancer cell apoptosis. Flow cytometry analysis of cell apoptosis after the MDA-MB-231 cells was treated with tsRNA-26576 inhibitor (A) and mimic (C). The statistical data of the apoptosis rates after transfected with tsRNA-26576 inhibitor (B) and mimic (D). All data are shown as the average value of 3 independent experiments. Error bars indicate ± SEM.
Abbreviation: NC, normal control.
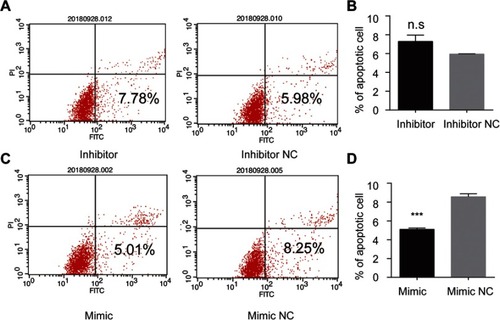
Figure 5 Scatter plot for GO term enrichment analysis and KEGG enrichment of DEGs. (A)The top 20 of GO enrichment after transfecting MDA-MB-231 cells with tsRNA-26576 inhibitor are displayed in the senior bubble chart. The size of the black circle measures the unigene number. Each different color indicates a different P-value used for significance verification. (B) The top 20 enrichment KEGG pathways after transfecting MDA-MB-231 cells with tsRNA-26576 inhibitor are displayed in the senior bubble chart. Rich factors are shown as the proportion of DEGs numbers to all gene numbers that are annotated in this pathway term. The size of the black circle indicates the unigene number. Each different color indicates a different P-value used for significance verification.
Abbreviation: DEG, differently expressed genes.
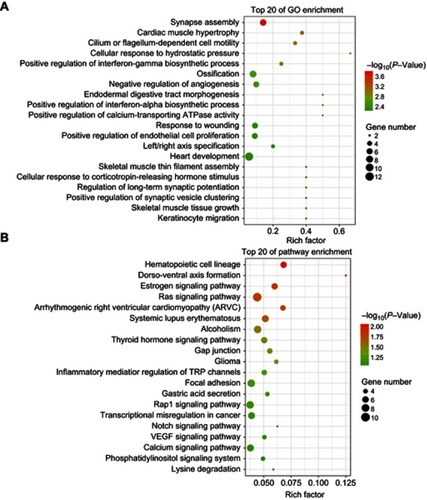
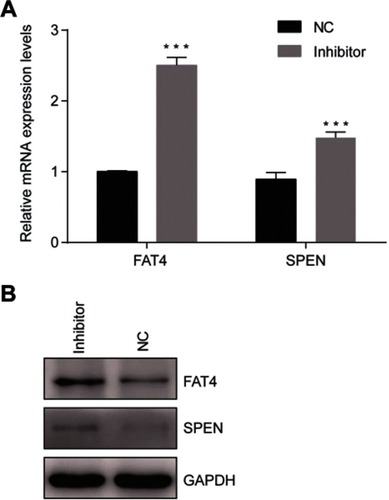
Figure 6 Confirmation of mRNA sequencing results by qRT-PCR. (A) Two genes were selected for the qRT-PCR analysis, including FAT4 and SPEN The GAPDH was chosen as the internal control. All data are shown as the average value of 3 independent experiments. Error bars indicate ± SEM. (B) Endogenous FAT4 and SPEN was immunoprecipitated with anti- FAT4 and anti-SPEN antibody after treating the cells with tsRNA-26576 inhibitor.
Abbreviation: NC, normal control.
Data availability
The datasets used and analyzed during the current study are available from the corresponding author on reasonable request.