Figures & data
Table 1 The mean tumor volume, weight and inhibition rate for each group
Figure 1 Growth of solid tumors. Tumors in the treatment groups were smaller than those in the control groups, with the reduction in tumor size more obvious in the high-dose miR-145 treatment group.
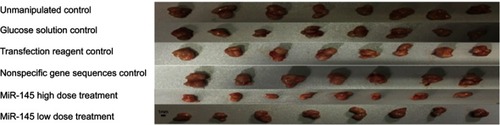
Figure 2 Pathological changes observed in the treatment and control groups (100×). Moderately differentiated squamous cell carcinoma was accompanied by necrosis. Tumors from mice in the miR-145 treatment groups showed areas of apoptotic cells with characteristic cell shrinkage, cytoplasmic condensation, and apoptotic bodies. These effects were more pronounced in the high-dose miR-145 treatment group. (A) Unmanipulated control group, (B) glucose solution control group, (C) transfection reagent control group, (D) non-specific gene sequence control group, (E) miR-145 high-dose (1.0 OD) group, and (F) miR-145 low-dose (0.5 OD) group.
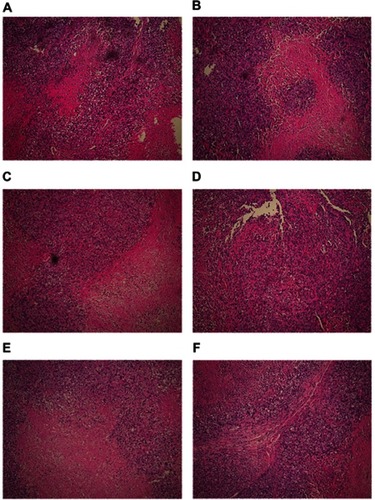
Figure 3 Electron microscopic examination of changes observed in the treatment and control groups (15,000×). Chromatin exhibited the edge-set phenomenon, and necrosis was observed. These effects were more prominent in the high-dose miR-145 treatment group. (A) Unmanipulated control group, (B) glucose solution control group, (C) transfection reagent control group, (D) non-specific gene sequence control group, (E) miR-145 high-dose (1.0 OD) group, and (F) miR-145 low-dose (0.5 OD) group.
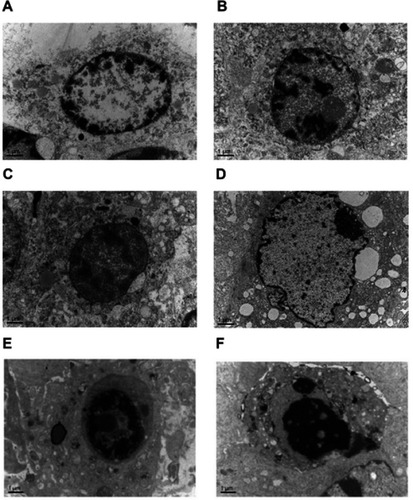
Figure 4 Effect of miR-145 on miR-145 expression in a nude mouse model of transplanted human LSCC AMC-HN-8 cells, relative to the unmanipulated control group; *p<0.05, **p<0.01.
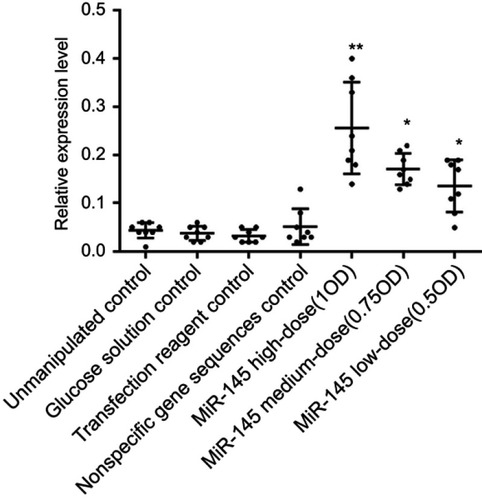
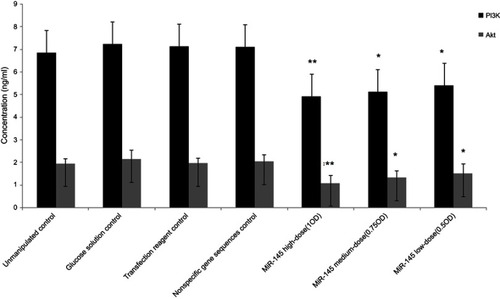
Figure 5 Effect of miR-145 on the expression of PI3K and Akt protein in human LSCC AMC-HN-8 cells transplanted into nude mice, relative to the unmanipulated control group; *p<0.05, **p<0.01.