Figures & data
Table 1 Literature inclusion basic information
Figure 1 Sensitivity forest map of the ROMA index for diagnosis of ovarian cancer (random effect model).
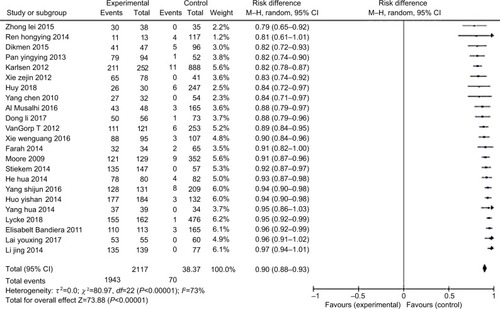
Figure 2 Specific forest map for diagnosis of ovarian cancer with the ROMA index (random effect model).
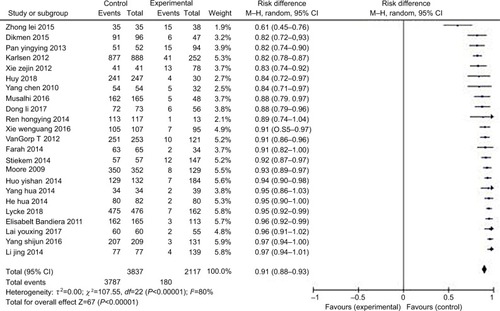
Figure 3 Positive predictive value of the ROMA index for diagnosis of ovarian cancer forest map (random effect model).
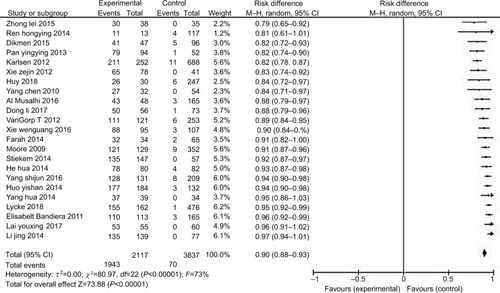
Figure 4 Negative predictive value of the ROMA index for diagnosis of ovarian cancer forest chart (random effect model).
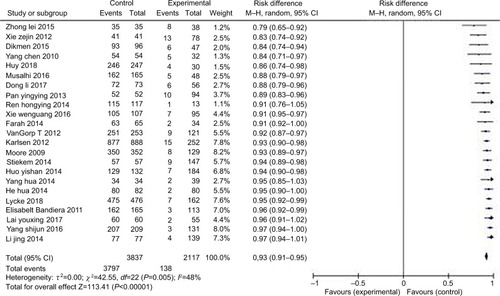
Figure 5 Area under ROC curve (AUC) of the ROMA index for diagnosis of ovarian cancer forest chart (random effect model).
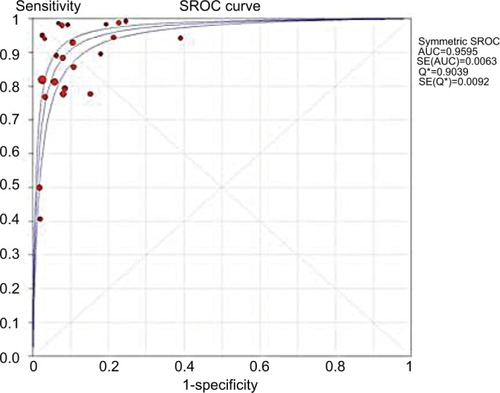
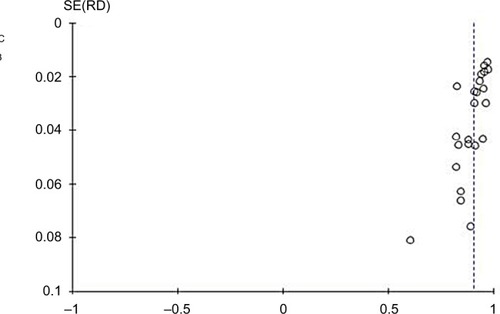
Figure 6 ROMA index evaluation of ovarian cancer risk bias analysis inverted funnel graph.
Abbreviation: RD, risk difference.