Figures & data
Table 1 Primers for RT-PCR
Figure 1 Identification of the differentially expressed circRNAs between CRC tissue and adjacent. (A) The cluster graph of the samples, red is relatively high expression, blank is medium, and green is relatively low expression. CA1, CA2, CA3, and CA4 are colorectal cancer tissues, and AP1, AP2, AP3, and AP4 are corresponding adjacent normal tissue. (B) The scatter plot, the values spotted in the X and Y axes represent the normalized signals of samples in the two groups (log2-scaled). (C) The volcano plot, the Y axes is -log10 (P-values) and the X axes is log2 (fold change). Among them, the red color is the up-regulated gene, the green color is the down-regulated gene, and the black color is the no significant difference gene.
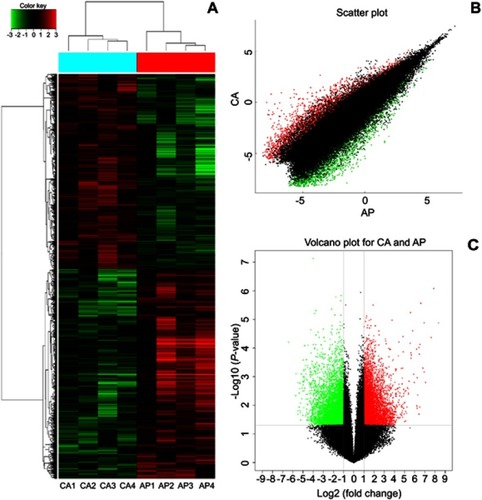
Figure 2 Twenty differently expressed circRNAs in the colorectal cancer (the fold-change ≥5 or ≤-5, P-value<0.01 and the ProcessedSignal≥100). Red is relatively high expression, green is relatively low expression. CA1, CA2, CA3, and CA4 are colorectal cancer tissues, and AP1, AP2, AP3, and AP4 are corresponding adjacent normal tissue. The first 11 are high expression circRNAs, the rest are low expression circRNAs.
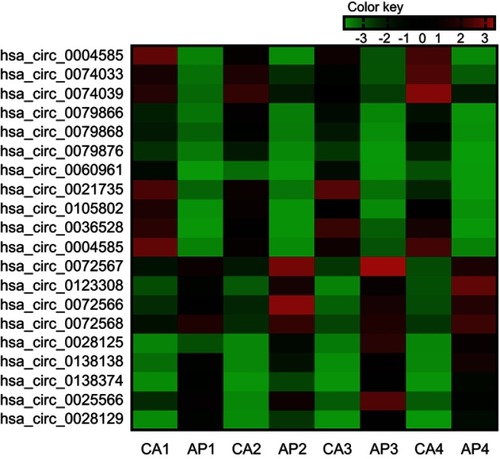
Figure 3 The enriched disease terms. The top 10 most significant enriched, (A) KEGG diseases terms, (B) FunDO terms, and (C) OMIM terms.
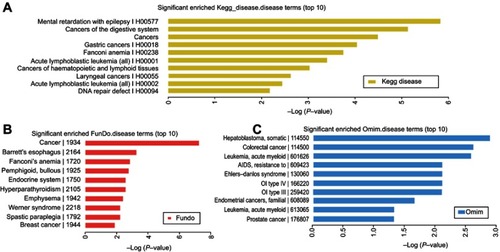
Figure 4 Validation of differential expression circRNAs by qRT-PCR in CRC and adjacent tissues. Scatterplots display the relative expression of specific circRNAs between CRC (Tumor) and adjacent tissues (Control). Scatter plot drawing with △CT value between CRC and adjacent tissues in Graphpad Software. hsa_circ_0004585, hsa_circ_0074033, and hsa_circ_0074039 are higher expression, hsa_circ_0072566, hsa_ circ_72567, and hsa_circ_72568 are downregulated in CRC tissue.
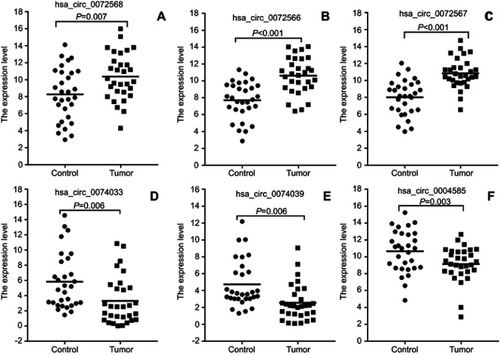
Figure 5 The expression level of hsa_circ_0004585. (A) The expression of hsa_circ_0004585 in 142 CRC patients’ peripheral samples compared with the normal healthy person group. (B and C) hsa_circ_0004585 was significantly upwnregulated in 92% (46/50) of 50 colorectal cancer patient tissues and the adjacent normal tissues.
Abbreviation: CT, cycle threshold.
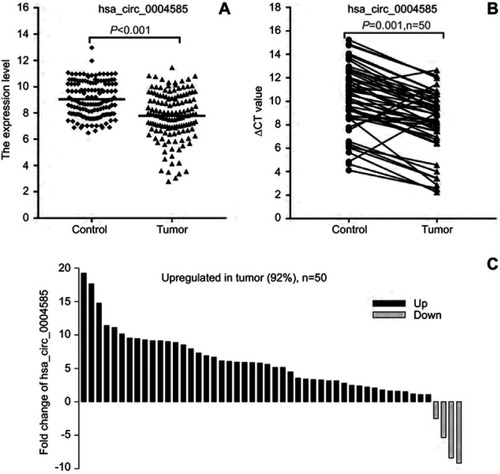
Table 2 Correlation between hsa_circ_0004585 expression and clinicopathological characteristics in 50 colorectal cancer patients
Table 3 Validation of the selected circRNAs by qPCR and ROC analysis
Figure 6 (A) ROC analysis for the expression hsa_circ_0004585 in 50 paired tissue of CRC patients. (B) ROC curves of the CRC person serum for the hsa_circ_0004585 expression.
Abbreviations: AUC, area under curve; ROC, receiver-operating characteristic.
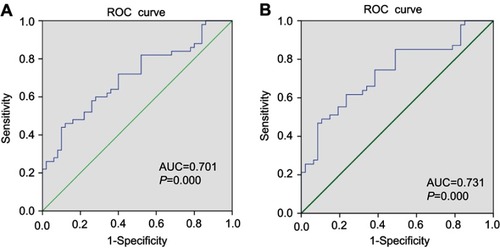
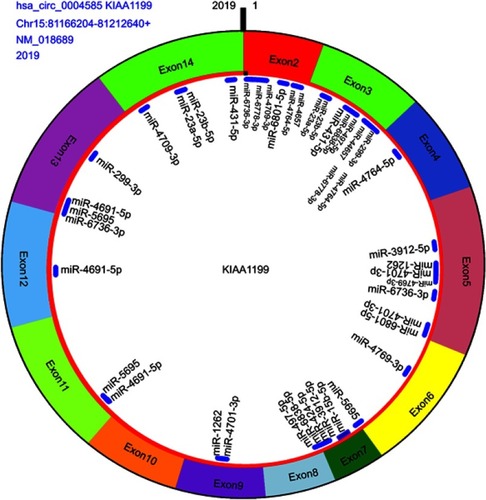
Table 4 More binding sites of miRNA with hsa_circ_0004585 top 20
Figure 7 The hsa_circ_0004585 structure and miRNA binding sites, including origin gene KIAA1199, exon2–exon14 composed this circRNA, this gene from Chromosome 15, location between 81,166,204 and 81,212,640, the molecule is 2019 bp and binding miRNA top 20 ().