Figures & data
Figure 1 Dsf inhibited TGFβ1-induced EMT in OSCC cells.
Notes: EMT in OSCC cells was induced by TGFβ1 stimulation for 6 days. Dsf was added to cells 24 hours before TGFβ1 induction to inhibit EMT. (A, E) Morphological changes in OSCC Smad4-mutated CAL27 and Smad4 wild-type SCC25 cells after stimulation with TGFβ1 (10 ng/mL) alone or combined with Dsf (5, 10, 20 μM) were observed under light microscopy. Bar 100 μm. (B, F) Aspect ratios of cells were quantified. Values represent mean ± SEM. (C, G) Western blot was performed to detect the expression of E-cadherin, vimentin and Snail in cells treated with TGFβ1 (10 ng/mL) alone or combined with Dsf (5, 10, 20 μM); quantitative results of Western blot from three independent experiments shown as mean ± SEM. (D, H) Expression of E-cadherin and vimentin examined through immunofluorescence assay by fluorescence microscopy in cells treated with TGFβ1 (10 ng/mL) alone or combined with Dsf (20 μM). *P<0.05; **P<0.01; ***P<0.001; bar 20 μm.
Abbreviations: Dsf, disulfiram; OSCC, oral squamous cell carcinoma; EMT, epithelial–mesenchymal transition.
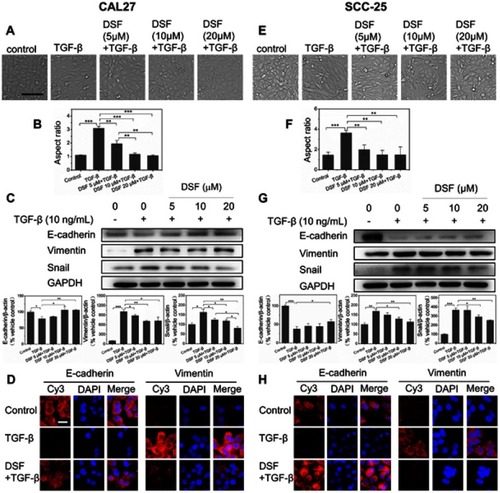
Figure 2 Dsf suppressed TGFβ1-induced migration and invasion in OSCC cells.
Notes: (A, E) Transwell-based migration assays were performed to check the effect of Dsf on cell migration of Smad4-mutated CAL27 and Smad4 wild-type SCC25 cells exposed to TGFβ1 (10 ng/mL). (B, F) Quantification of cell migration. (C, G) Transwell-based invasion assays were performed to check the effect of Dsf on cell invasion of Smad4-mutated CAL27 and Smad4 wild-type SCC25 cells exposed to TGFβ1 (10 ng/mL). (D, H) Quantification of cell invasion. Values represent mean ± SEM. *P<0.05; **P<0.01; ***P<0.001; bar 300 μm.
Abbreviation: Dsf, disulfiram; OSCC, oral squamous cell carcinoma.
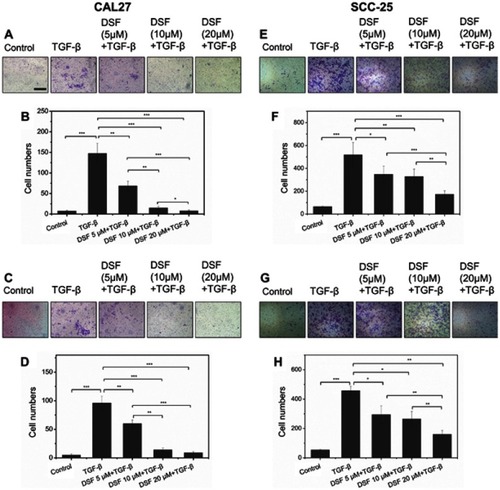
Figure 3 Dsf regulated EMT of OSCC cells through TGFβ–ERK–Snail pathway independently of Smad4.
Notes: (A, D) Western blot results of p-ERK and ERK derived from Smad4-mutated CAL27 and Smad4 wild-type SCC25 stimulated by TGFβ1 for different periods (5, 15, 30, 60 minutes) or combined with Dsf (20 μM) pretreatment for 24 hours; quantitative results of Western blot from three independent experiments shown as mean ± SEM. Direct role of TGFβ–ERK–Snail pathway investigated using U0126, a chemical inhibitor of MEK1/2 and upstream activator of ERK. (B, E) Transwell-based migration and invasion assays were performed after cells had been exposed to TGFβ1 (10 ng/mL) alone or combined with U0126 (20 μM); quantification of cell migration and invasion shown as means ± SEM. (C, F) Western blot results of p-ERK, ERK, E-cadherin, vimentin and Snail from cells exposed to TGFβ1 (10 ng/mL) alone or combined with U0126 (20 μM); quantitative results of Western blot from three independent experiments shown as mean ± SEM. *P<0.05; **P<0.01; ***P<0.001; bar 200 μm.
Abbreviations: Dsf, disulfiram; OSCC, oral squamous cell carcinoma; EMT, epithelial–mesenchymal transition.
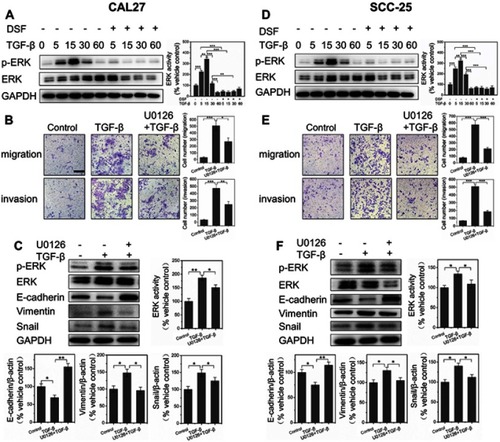
Figure 4 In vivo anti-metastasis effect of Dsf.
Notes: Mice were intravenously injected with CAL27 cells pretreated by TGFβ1 (10 ng/mL) alone or combined with Dsf (20 μM). (A) Typical mouse with macroscopic tumors at the buttocks after injection of CAL27 cells from vertical view (upper panel), lateral view (middle panel), and the tumors. (B) Metastatic tumor nodule on the lung were observed by naked eye (left panel) and H&E staining (right panel, 40× magnification, bar 400 μm). (C) Expression of Ki67, vimentin and Snail in tumor tissue assessed with immunohistochemical staining (100× magnification, bar 200 μm and 400× magnification, bar 50 μm).
Abbreviation: Dsf, disulfiram.
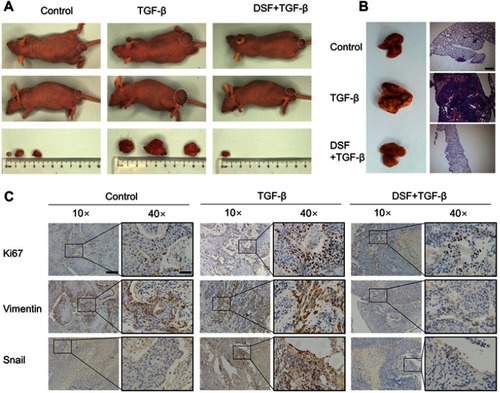
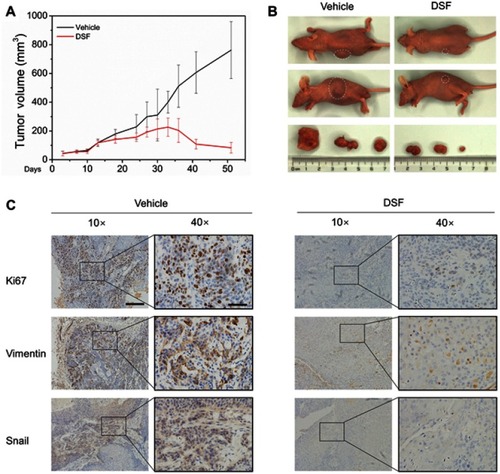
Figure 5 Dsf inhibited OSCC-tumor growth in vivo.
Notes: Mice with subcutaneous xenografts of CAL27 cells were randomly divided into two group (five mice/group): vehicle control (PBS intragastrically) and Dsf (50 mg/kg intragastrically). PBS or Dsf were administered twice a week for 38 days and tumors removed for analysis. (A) Growth curves of tumor size. Values represent mean ± SEM. (B) Typical mouse bearing tumors from vertical view (upper panel), lateral view (middle panel), and the tumors (lower panel). (C) Expression of Ki67, vimentin and Snail in tumor tissue was assessed with immunohistochemical staining (100× magnification, bar 200 μm and 400× magnification, bar 50 μm).
Abbreviations: Dsf, disulfiram; OSCC, oral squamous cell carcinoma.