Figures & data
Figure 1 Two steps process for synthesizing the PION@E6.
Abbreviations: DSPE-PEG200, 2-distearoyl-sn-glycero-3-phosphoethanolamine-N-[methoxy(polyethylene glycol)-2000]; PION@E6, PEGylated iron oxide nanoparticles.
![Figure 1 Two steps process for synthesizing the PION@E6.Abbreviations: DSPE-PEG200, 2-distearoyl-sn-glycero-3-phosphoethanolamine-N-[methoxy(polyethylene glycol)-2000]; PION@E6, PEGylated iron oxide nanoparticles.](/cms/asset/57f46ceb-d988-4666-97f8-0e3cdb678418/dcmr_a_12186426_f0001_b.jpg)
Figure 2 Identification and characterization of PION@E6.
Notes: (A) Hydrate particle size of PION@E6. (B) Zeta potential of PION@E6. (C) Representative photo of PION@E6 under TEM (Bar =50 µm in the field). (D) Absorption spectra of both PION@E6 and free E6. (E) Representative photos of aqueous solutions of PION@E6 taken at the first day and the thirtieth day. (F) Colloid stability test of PION@E6 dissolved in deionized water. (G) Fluorescence spectra of PION@E6 and chlorin e6.
Abbreviations: PION@E6, PEGylated iron oxide nanoparticles; TEM, transmission electron microscopy.
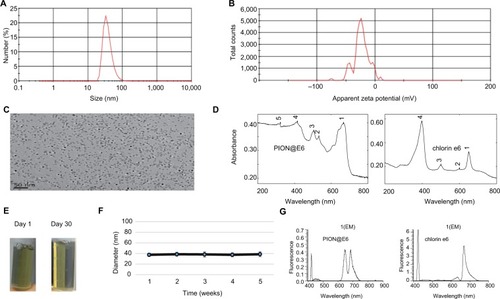
Figure 3 Uptake of PION@E6 by U251 cells incubated with 50 µg/mL of PION@E6 for 2 hours.
Notes: (A) Bright imaging of U251 cells (magnification ×200); (B) Representative image of U251 cells stained with Prussian blue (magnification ×200).
Abbreviation: PION@E6, PEGylated iron oxide nanoparticles.
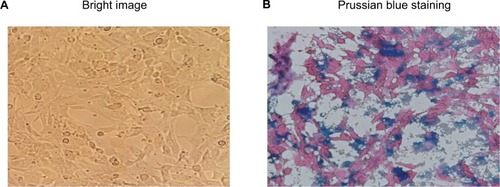
Figure 4 Cell viability of U251 cells incubated with various concentration of PION@E6 for 24 hours.
Notes: Error bars were based on SD of 4 samples. *P<0.05, compared with control group.
Abbreviation: PION@E6, PEGylated iron oxide nanoparticles.
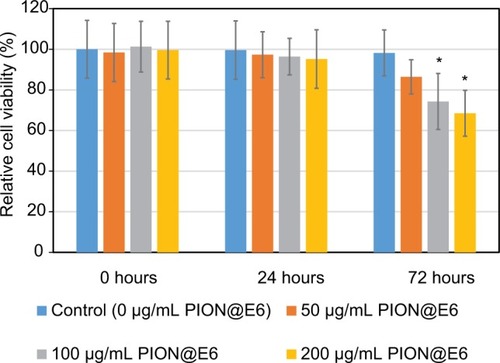
Figure 5 Migration of U251 cells incubated with 200 µg/mL PION@E6 in the presence or absence of autophagy inhibitor 3-MA.
Notes: (A) Representative image of migratory U251 cells (×200) by crystal violet staining after incubation with 0 µg/mL PION@E6 for 24 hours in the absence of 3-MA. (B) Representative image of migratory U251 cells (×200) by crystal violet staining after incubation with 200 µg/mL PION@E6 for 24 hours in the absence of 3-MA. (C) Representative image of migratory U251 cells (×200) by crystal violet staining after incubation with 200 µg/mL PION@E6 for 24 hours in the presence of 3-MA. (D) Number of migratory U251 cells per field of microscopy view. Error bars were as based on SD of 3 replicates. *P<0.05, statistically significant.
Abbreviations: 3-MA, 3-methyladenine; PION@E6, PEGylated iron oxide nanoparticles.
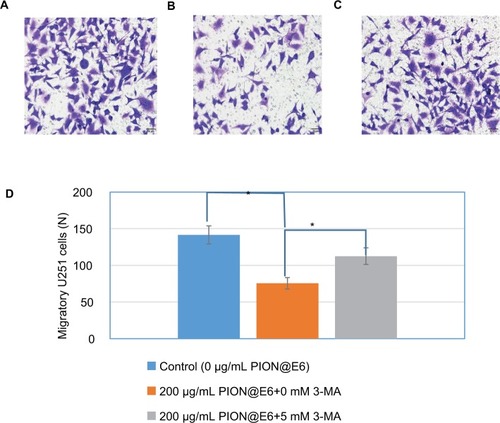
Figure 6 Invasion of U251 cells incubated with 200 µg/mL PION@E6 in the presence or absence of autophagy inhibitor 3-MA.
Notes: (A) Representative image of invasive U251 cells (×200) by crystal violet staining after incubation with 0 µg/mL PION@E6 for 24 hours in the absence of 3-MA. (B) Representative image of invasive U251 cells (×200) by crystal violet staining after incubation with 200 µg/mL PION@E6 for 24 hours in the absence of 3-MA. (C) Representative image of invasive U251 cells (×200) by crystal violet staining after incubation with 200 µg/mL PION@E6 for 24 hours in the presence of 3-MA. (D) Number of invasive U251 cells per field of microscopy view. Error bars were as based on SD of 3 replicates. *P<0.05, statistically significant.
Abbreviations: 3-MA, 3-methyladenine; PION@E6, PEGylated iron oxide nanoparticles.
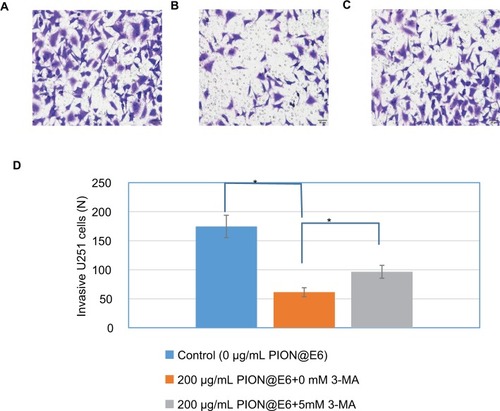
Figure 7 Invasion of U251 cells incubated with different concentrations of PION@E6 for 24 hours.
Notes: The representative images of invasive U251 cells (×200) treated by different concentrations of PION@E6 by crystal violet staining (A–D). (A) Control. (B) 50 µg/ mL PION@E6. (C) 100 µg/mL PION@E6. (D) 200 µg/mL PION@E6. (E) Number of invasive U251 cells per field of microscopy view. Each group consists of 3 replicates. Error bars were based on SD of 3 replicates. *P<0.05, compared with control group. **P<0.05, compared with those treated with 50 µg/mL PIONs@E6. ***P<0.05, compared with those treated with 100 µg/mL PION@E6.
Abbreviation: PION@E6, PEGylated iron oxide nanoparticles.
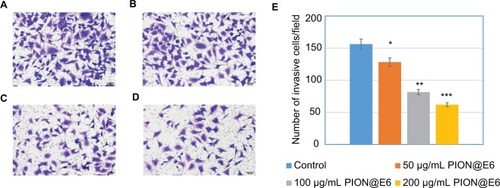
Figure 8 Expression of key regulator of autophagy-related proteins in U251 cells incubated with different concentrations of PIONs for 24 hours.
Notes: (A) Expression of beclin-1 and P62 proteins in U251 cells determined by Western blotting. (B) Expression of LC3 protein in U251 cells by Western blotting. (C) Relative expression of beclin-1 and P62 proteins normalized to GAPDH in U251 cells. (D) Relative expression of LC3II relative to LC3I protein in U251 cells. Error bars were based on SD of 3 replicates. *P<0.05, compared with control group. **P<0.05, compared with those incubated with 50 µg/mL PION@E6. ***P<0.05, compared with those incubated with 100 µg/mL PION@E6.
Abbreviations: GAPDH, glyceraldehyde 3-phosphate dehydrogenase; PION@E6, PEGylated iron oxide nanoparticles.
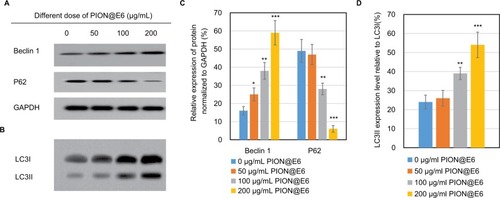
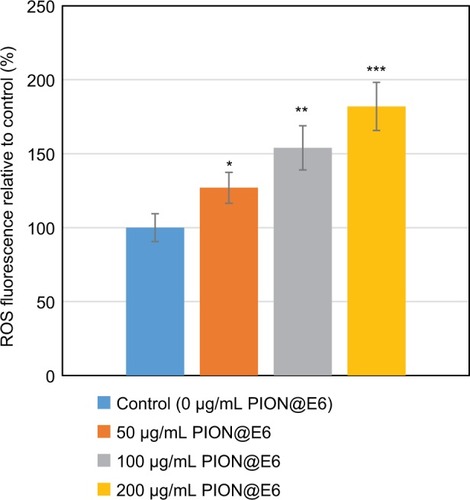
Figure 9 Relative intracellular ROS in the U251 cells when incubation with different concentrations of PIONs@E6 for 12 hours.
Notes: Each group consists of 8 samples. Error bars were based on SD of 8 samples. *P<0.05, compared with control group. **P<0.05, compared with those incubated with 50 µg/mL PION@E6. ***P<0.05, compared with those incubated with 100 µg/mL PION@E6.
Abbreviation: PION@E6, PEGylated iron oxide nanoparticles.