Figures & data
Table 1 Important parameters analyzed in the study
Table 2 Clinicopathologic characteristics of P-NET patients in the SEER cohort and validation cohort
Table 3 Multivariate analysis of prognostic factors in the SEER cohort
Table 4 Comparison of different models for OS prediction in the SEER cohort
Figure 1 Prognostic nomogram for P-NET. This nomogram consists of eight lines. The first line is the point line for each variable axis. Then the next four lines are variable axes, including “Age”, “Sex”, “Histologic Grade” and “Stage”. For an individual patient, a vertical line is made between each variable axe and the point line, which determines the number of point for each variable. After summing these points to get the total points, a vertical line can be drawn between the “Total Points” line and “3-year survival probability” or “5-year survival probability” line to determine the probability of 3 or 5-year survival, respectively. Stage, American Joint Committee on Cancer (AJCC) staging classification established by AJCC in 2010; Histologic Grade is assessed by tissue differentiation based on HE staining.
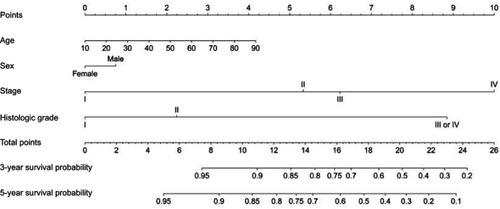
Figure 2 The calibration curve for predicting patient survival at 3 years (A) and 5 years (B) in the SEER cohort. Nomogram-predicted probability of overall survival is labeled on the x-axis; actual overall survival is labeled on the y-axis.
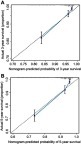
Figure 3 The calibration curve for predicting patient survival at 5 years in the validation cohort. Nomogram-predicted probability of overall survival is labeled on the x-axis; actual overall survival is labeled on the y-axis.
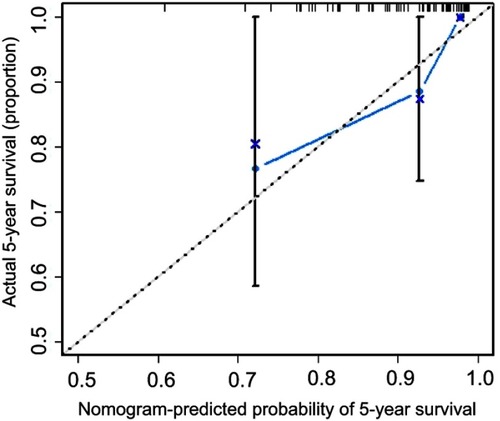
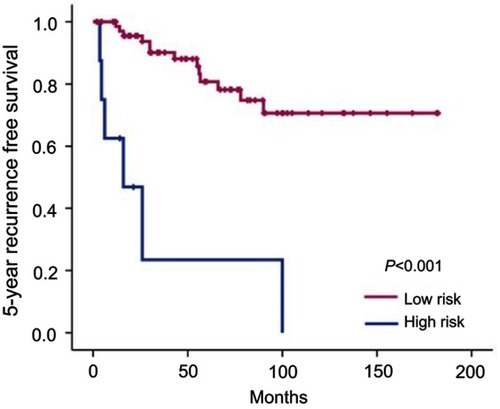
Figure 4 Kaplan-Meier curves showing the 5 year RFS in high risk and low risk group in the validation cohort. High risk was defined as total points >13.5 by the nomogram and low risk as total points <13.5 by the nomogram.