Figures & data
Table 1 The comparison of demographic and clinicopathological factors between training cohort and validation cohort
Table 2 Univariate and multivariate logistic analyses of liver metastasis in patients PDAC
Figure 1 Nomograms predicting risk of the liver metastasis in patients with pancreatic ductal adenocarcinoma (A, model 1; B, model 2).
Notes: Model 1: predictive model consisted of clinical and pathological factors; model 2: predictive model consisted of model 1 and additional distant metastatic sites.
Abbreviation: LN, lymph node.
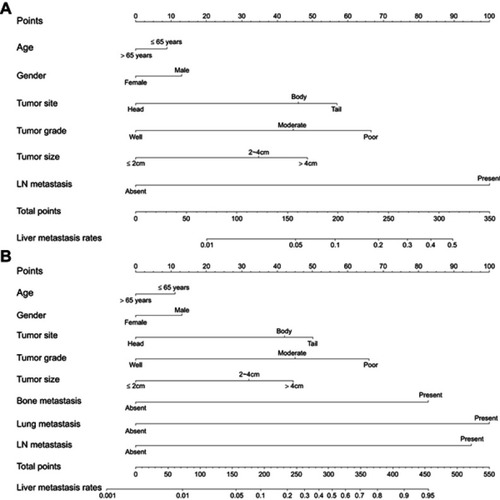
Figure 2 The calibration plots and ROC curves of model 1 in the training cohort (A and C, respectively) and the validation cohort (B and D, respectively).
Notes: Model 1: predictive model consisted of clinical and pathological factors.
Abbreviation: ROC, receiver operating characteristic.
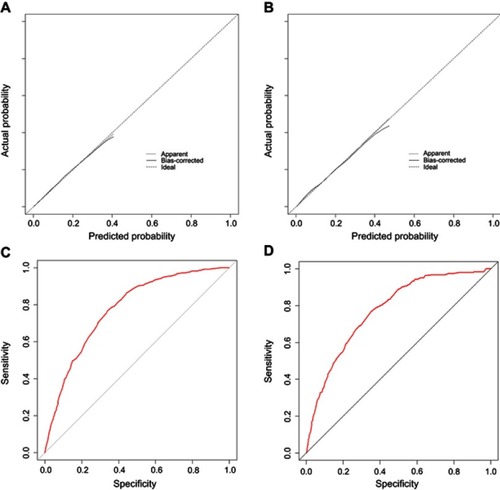
Figure 3 The calibration plots and ROC curves of model 2 in the training cohort (A and C, respectively) and validation cohort (B and D, respectively).
Notes: Model 2: predictive model consisted of model 1 and additional distant metastatic sites.
Abbreviation: ROC, receiver operating characteristic.
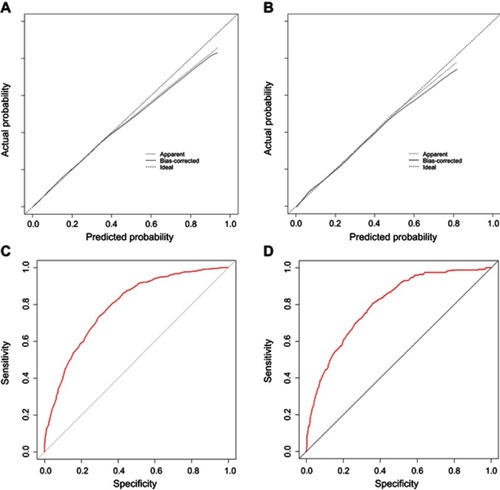
Table 3 Comparison of the C-index values and likelihood ratio tests between two models
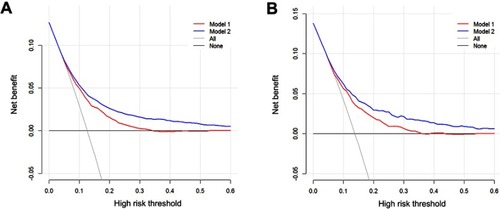
Figure 4 Decision curve analysis for models 1 and 2. The y-axis represents net benefit. The x-axis shows the threshold probability. “All” refers to the assumption that all patients have liver metastasis and “none” to the assumption that no patient had liver metastasis.
Notes: Model 1: predictive model consisted of clinical and pathological factors; model 2: predictive model consisted of model 1 and additional distant metastatic sites.