Figures & data
Table 1 Association of the clinicopathologic variables with the expression levels of Sp1
Table 2 Primers for real-time RT-PCR
Figure 1 Irradiation increases the expression of Sp1 in cervical cancer cell lines. RT-qPCR assay showed Sp1 mRNA levels in SiHa (A) and HeLa (B) cells treated with doses of radiation. Western blot assay showed Sp1 protein levels in SiHa (C) and HeLa (D) cells treated with doses of radiation. Results shown are mean (±SD) values from three independent experiments. *P<0.05; **P<0.01; ***P<0.001.
Abbreviation: RT-qPCR: real-time quantitative PCR.
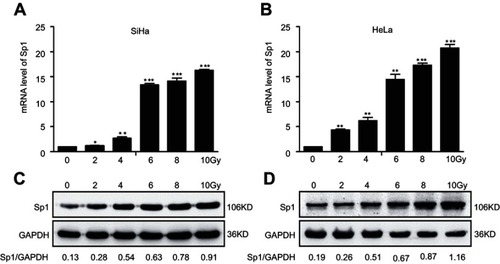
Figure 2 Sp1 is related to the radioresistance of cervical cancer cells. Downregulation of Sp1 caused a significant decrease of surviving fraction in SiHa (A) and HeLa (B) cells compared to the control-scramble-infected cells. Upregulation of Sp1 caused a significant increase of surviving fraction in SiHa (C) and HeLa (D) cells compared to control-mock-infected cells. *P<0.05; **P<0.01; ***P<0.001.
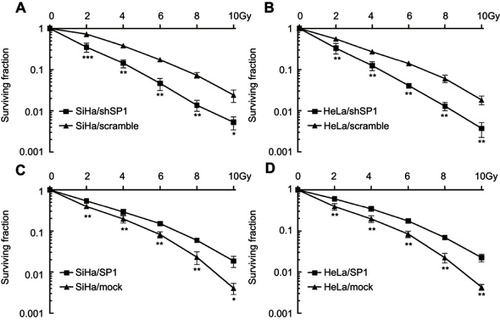
Figure 3 Sp1 promotes migration and invasion of cervical cancer cells in response to radiation. (A). Wound-healing assay of the four groups in cervical cancer cells. (B). Transwell migration assay of the four groups in cervical cancer cells (scale bar, 50 μm). (C). Cell migration was quantified as percentage of wound-healed area. (D). Average number of invading cells per field from three independent experiments. Data represent means ± SD of five randomly selected areas. *P<0.05.
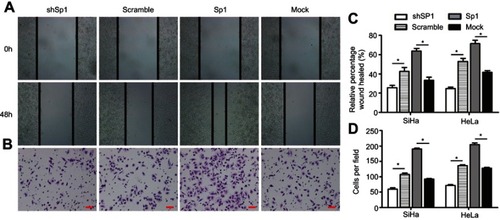
Figure 4 Sp1 modulates G2/M cell-cycle arrest in cervical cancer cells. (A) The G2/M phase arrest was more obviously in the Sp1-silenced SiHa and HeLa cells than control silenced cervical cancer cells. (B) The G2/M phase arrest was ameliorated more in Sp1-overexpressed SiHa and HeLa cells compared to the control cells. Representative statistic data are shown at the right panel. Results shown are mean (±SD) values from three independent experiments. *P<0.05; **P<0.01.
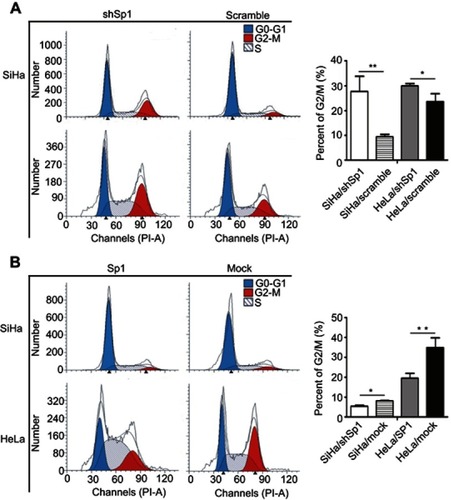
Figure 5 Sp1 targets directly CDK1 in cervical cancer cells. RT-qPCR assay showed the mRNA levels of CDK1 (A), cyclinA (B), and cyclinB (C) in SiHa and HeLa cells with the altered expression of Sp1. (D) Western blot assay showed the protein levels of CDK1 with the altered expression of Sp1. (E) Schematic structure of the CDK1 upstream promoter containing a Sp1-binding site. (F) Dual-luciferase reporter assay showed that transient cotransfection of the CDK1-promoter with pcDNA3.1-Sp1 into SiHa and Hela cells led to a significant increase in firefly luciferase activity compared to the control group. Results shown are mean (±SD) values from three independent experiments. *P<0.05; **P<0.01.
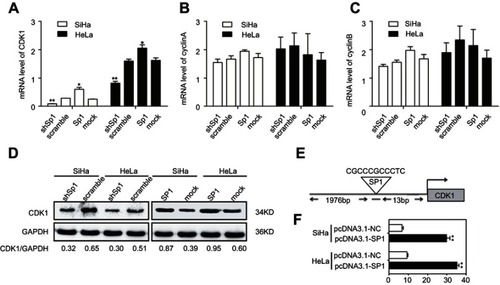
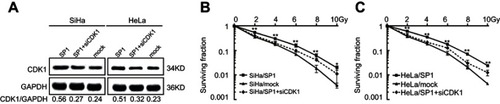
Figure 6 The radioresistant effect of Sp1 is dependent on CDK1. (A) CDK1 expression was silenced in SiHa/Sp1 and HeLa/Sp1 cells using siRNAs followed by treatment with RT. The rescue experiments showed that the increase of surviving fraction in SiHa/SP1 (B), HeLa/SP1 (C) could be suppressed by inhibiting CDK1. *P<0.05; **P<0.01.