Figures & data
Table 1 Clinicopathological features of patients with urothelial carcinoma of the bladder (UCB)
Figure 1 Increased expression of Nrf2 and TUG1 in urothelial carcinoma of the bladder (UCB) tissues. (A and B) 27 pairs of UCB tissues and paired normal tissues were collected and analyzed for the expression of Nrf2 and TUG1 by RT-PCR. (C) Correlation analysis of Nrf2 and TUG1 expression in UCB tissues. *P<0.05.
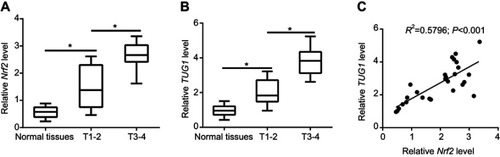
Figure 2 Up-regulation of Nrf2 and TUG1 in ADM-resistant cells. (A and B) Nrf2 expression was measured in UCB cell lines (EJ-1, 5637, BIU-87 and T24) and normal human urothelial cells (SV-HUC-1) by RT-PCR and Western blot. (C) Western blot analysis of Nrf2 expression showed increased expression of Nrf2 in ADM-resistant cells (BIU-87/ADM and T24/ADM). (D) TUG1 expression was measured in UCB cell lines (EJ-1, 5637, BIU-87 and T24) and SV-HUC-1 cells by RT-PCR. (E) RT-PCR analysis of TUG1 expression indicated increased expression of TUG1 in BIU-87/ADM and T24/ADM cells. **P<0.01 and ***P<0.001.
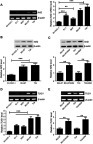
Figure 3 Nrf2 positively regulates the expression of TUG1 in UCB cells. (A) BIU-87 and T24 cells were transfected with pcDNA-Nrf2, si-Nrf2 or matched controls, and the transfection efficiency was identified by Western blot. (B) BIU-87 and T24 cells were treated with different doses (0.1 and 0.2 μM) of ML385, and Nrf2 levels were determined by Western blot. (C and D) RT-PCR analysis of TUG1 expression indicated increased expression of TUG1 in BIU-87 and T24 cells transfected with pcDNA-Nrf2. (E and F) RT-PCR analysis of TUG1 expression indicated decreased expression of TUG1 in BIU-87 and T24 cells transfected with si-Nrf2. (G and H) RT-PCR analysis of TUG1 expression showed down-regulation of TUG1 in BIU-87 and T24 cells treated with ML385. *P<0.05, **P<0.01 and ***P<0.001.
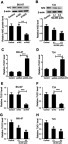
Figure 4 Knockdown of either Nrf2 or TUG1 inhibits the progression of UCB in vitro. BIU-87 and T24 cells were transfected with si-Nrf2, si-TUG1 or si-NC. (A) Cell viability was analyzed at the indicated time-points (0, 1, 2, 3 days after transfection) by CCK-8 assay. (B and C) Ki-67 expression was measured 48 h post-transfection by Western blot. (D and E) The invasion ability of BIU-87 and T24 cells was determined 48 h post-transfection by transwell invasion assay. (F and G) The protein levels of MMP-2 and MMP-9 were examined by Western blot. (H and I) Cell apoptosis was analyzed 48 h post-transfection by flow cytometry. (J and K) Cleaved caspase-3 levels were evaluated in BIU-87 and T24 cells transfected with si-Nrf2 or si-TUG1 by Western blot.*P<0.05, **P<0.01 and ***P<0.001.
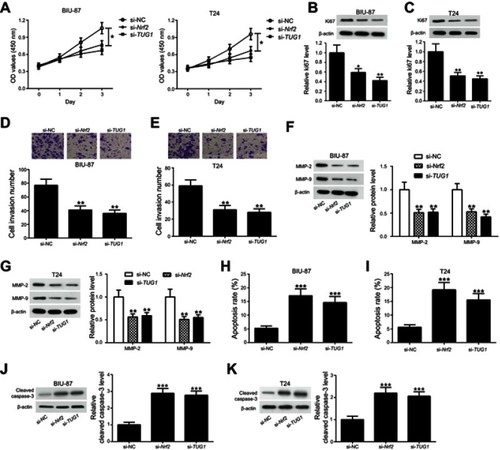
Figure 5 Knockdown of either Nrf2 or TUG1 enhances the chemosensitivity of ADM-resistant UCB cells to ADM. (A) RT-PCR analysis of MDR1 mRNA expression indicated up-regulation of MDR1 in BIU-87/ADM and T24/ADM cells. (B) Western blot analysis of p-gp expression showed elevated expression of p-gp in BIU-87/ADM and T24/ADM cells. (C) BIU-87/ADM and T24/ADM cells were transfected with si-Nrf2, si-TUG1 or si-NC, followed by exposure to indicated doses (0, 5, 10, 20 and 40 μg/ml) of ADM. Cell viability was determined using CCK-8 assay. (D and E) BIU-87/ADM and T24/ADM cells were transfected with si-Nrf2, si-TUG1 or si-NC. At 48 h post transfection, the expression of p-pg was evaluated by Western blot. *P<0.05, **P<0.01 and ***P<0.001.
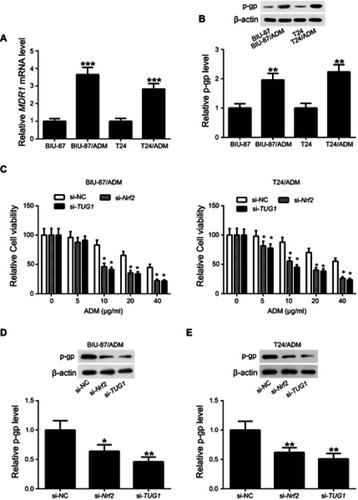
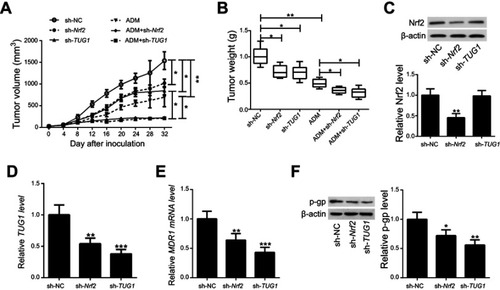
Figure 6 Knockdown of either Nrf2 or TUG1 enhances the sensitivity of UCB cells to ADM in vivo. T24/ADM cells stably expressing sh-Nrf2, sh-TUG1 or sh-NC were subcutaneously injected into nude mice. Subsequently, mice were intraperitoneally injected with ADM or saline. (A) Tumor growth curves of T24/ADM cells transfected with sh-Nrf2, sh-TUG1 or sh-NC and treated with ADM or saline in vivo. (B) The mean tumor weight of the six groups. (C) Western blot analysis was performed to examine expression of Nrf2 protein in xenografted tumors. (D and E) RT-PCR analysis of TUG1 and MDR1 mRNA expression in xenografted tumors. (F) Western blot analysis of p-gp protein expression in xenografted tumors. *P<0.05, **P<0.01 and ***P<0.001.