
Figures & data
Table 1 Demographic and characteristics among oral cancer patients
Figure 1 Higher expression levels of CIP2A in OSCCs. (A) Representative immunohistochemical expression patterns of CIP2A in nontumor tissues and OSCC specimens are shown. (B) Kaplan–Meier survival curves showing the difference of survival time between patients with low- and high-expression CIP2A on OSCC samples from 133 patients.Abbreviations: CIP2A, cancerous inhibitor of protein phosphatase 2A; OSCC, oral squamous cell carcinoma.
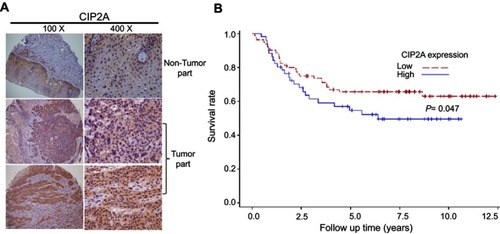
Table 2 Clinicopathologic factors associated with CIP2A expression
Table 3 The effect of clinicopathologic factor and CIP2A expression on mortality density and adjusted hazard ratio (aHR) among OSCC patients