
Figures & data
Table 1 Prognostic analysis of MPM patients
Figure 1 The optimal cutoff value of pretreatment SII of malignant pleural mesothelioma patients based on ROC curve.
Abbreviations: ROC, receiver operating characteristic; SII, systemic immune–inflammation index.
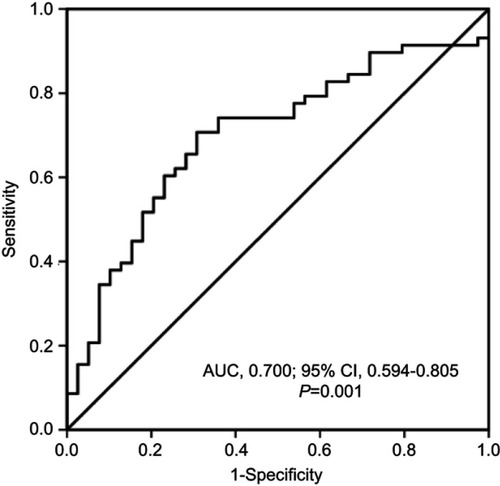
Figure 2 Kaplan–Meier survival curves of ECOG PS, pretreatment SII and treatment strategy for malignant pleural mesothelioma patients.
Abbreviations: ECOG PS, Eastern Cooperative Oncology Group performance status; MST, median survival time; SII, systemic immune–inflammation index.
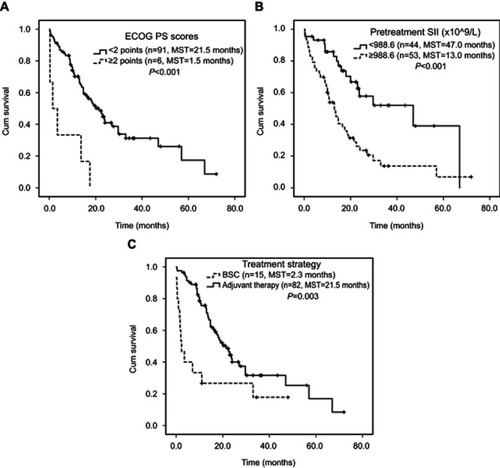
Table 2 Relationship between pretreatment SII and clinicopathological characteristics