Figures & data
Figure 1 The expression of HOXA10 was increased in gastric cancer tissues and cells. (A) The expression of HOXA10 protein in 20 matched gastric cancer tissues and the normal tissues was detected by IHC, and 3 images were shown (scale bar=100 μm). (B) The expression of HOXA10 protein in 20 matched gastric cancer tissues and the normal tissues was detected by Western blotting, and the most representative images were shown. (C) Western blotting analysis of the HOXA10 protein levels in normal gastric cell line GES 1 and gastric cancer cell lines NCI-N87, MKN28 and SGC-7901. (*P<0.05, **P<0.01).
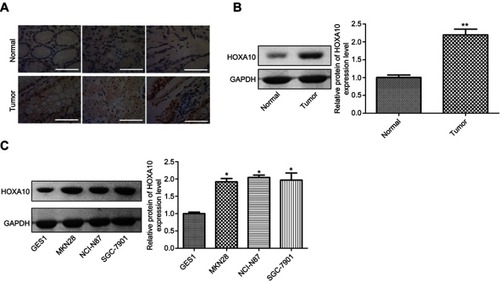
Figure 2 HOXA10 functioned as an oncogene in gastric cancer. (A–B) qPCR and Western blotting assays were executed to determine the mRNA and protein expression of HOXA10 after MKN28/NCI-N87 cells were infected with OE-HOXA10, OE-NC, sh-HOXA10 or sh-NC. (C–D) MTT assay was used to test the effects of OE-HOXA10/sh-HOXA10 on cell proliferation. (E) Cell cloning formation abilities under OE-HOXA10/sh-HOXA10 treatment were assessed by cloning formation assay. (F) Cell apoptosis population was determined by flow cytometry assay. (*P<0.05, **P<0.01, sh-HOXA10 group compared with sh-NC group; #P<0.05, ##P<0.01, OE-HOXA10 group compared with OE-NC group).
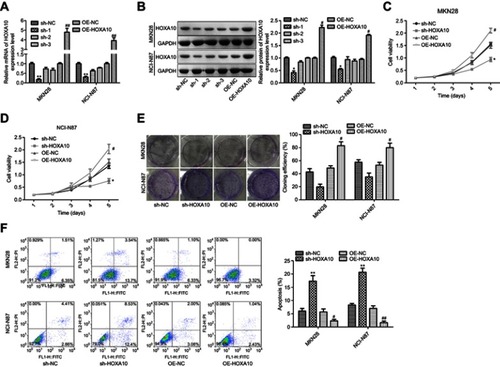
Figure 3 Over-expression of HOXA10 promoted the activation of JAK1/STAT3 signaling in gastric cancer. OE-HOXA10, OE-NC, sh-HOXA10 and sh-NC lentivirus vectors were transiently transfected into MKN28 and NCI-N87 cells, then (A–B) The expression of proteins in JAK family (JAK1-3 and Tyk2) and their protein phosphorylation levels were assessed by Western blotting assay. (C–D) Both total and phosphorylated levels (p-) of STAT3 and STAT5B were determined by Western blotting. (E) Immunofluorescence assay was used to decide the effects of HOXA10 expression on STAT3 subcellular location. (*P<0.05, **P<0.01, sh-HOXA10 group compared with sh-NC group; #P<0.05, ##P<0.01, OE-HOXA10 group compared with OE-NC group).
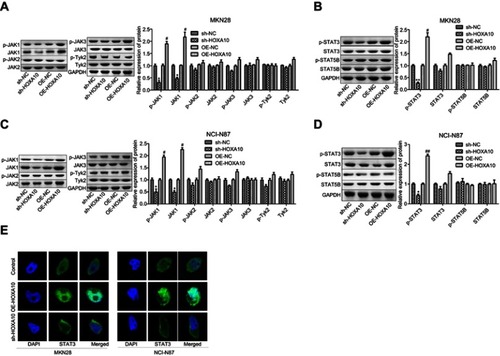
Figure 4 HOXA10 promoted cell viability and inhibited cell apoptosis through activating JAK1 signaling in gastric cancer. (A–B) qPCR and Western blotting assays were executed to determine the mRNA and protein expression of JAK1 after MKN28 or NCI-N87 cells were transfected with sh-JAK1 or sh-NC. (C–D) MTT assay was used to test cell proliferation after MKN28 or NCI-N87 cells were transfected with OE-HOXA10 or OE-HOXA10+sh-JAK1. (E) Cell cloning formation abilities were assessed by cloning formation assay after MKN28 or NCI-N87 cells were stably transfected with OE-HOXA10 or OE-HOXA10+sh-JAK1. (F) Cell apoptosis population was determined by flow cytometry assay after MKN28 or NCI-N87 cells were transfected with OE-HOXA10 or OE-HOXA10+sh-JAK1. (*P<0.05, **P<0.01, OE-HOXA10 group compared with control group; #P<0.05, OE-HOXA10+sh-JAK1 group compared with OE-HOXA10 group).
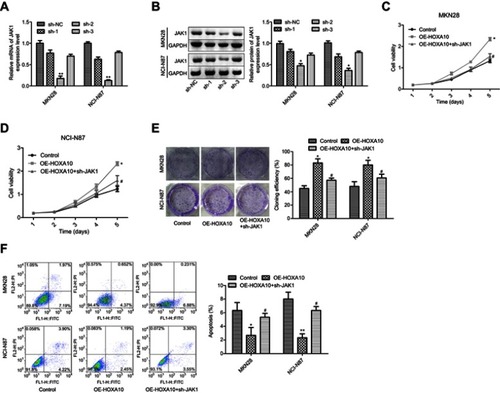
Figure 5 HOXA10 promoted cell viability and inhibited cell apoptosis through activating STAT3 signaling in gastric cancer. (A–B) qPCR and Western blotting assays were executed to determine the mRNA and protein expression of STAT3 after MKN28 or NCI-N87 cells were transfected with sh-STAT3 or sh-NC (*P<0.05, **P<0.01, compared with sh-NC group). (C–D) Western blotting assay was performed to detect the expression of STAT3 and p-STAT3 after MKN28 or NCI-N87 cells were transfected with sh-STAT3 or sh-NC. (E–F) MTT assay was used to test cell proliferation after MKN28 or NCI-N87 cells were transfected with OE-HOXA10 or OE-HOXA10+sh-STAT3. (G) Cell cloning formation abilities were assessed by cloning formation assay after MKN28 or NCI-N87 cells were stably transfected with OE-HOXA10 or OE-HOXA10+sh-STAT3. (H) Cell apoptosis population was determined by flow cytometry assay after MKN28 or NCI-N87 cells were transfected with OE-HOXA10 or OE-HOXA10+sh-STAT3. (*P<0.05, **P<0.01, OE-HOXA10 group compared with control group; #P<0.05, OE-HOXA10+sh-STAT3 group compared with OE-HOXA10 group).
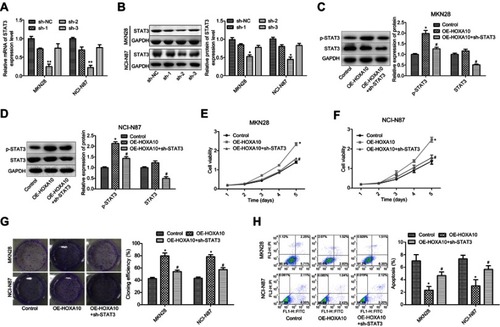
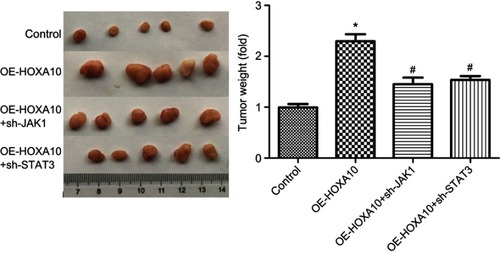
Figure 6 HOXA10 promoted NCI-N87 cell tumorigenesis through activating JAK1/STAT3 signaling. NCI-N87 cells were stably transfected with OE-HOXA10, OE-HOXA10+sh-JAK1, OE-HOXA1-+sh-STAT3 or their negative control vectors; then, the stable cell lines (5×10⁶ cells for each group) were injected into the nude mice. And all mice were killed 28 days post-implantation and the image showed the tumor shape and average weights of each group. (*P<0.05, OE-HOXA10 group compared with control group; #P<0.05, OE-HOXA10+sh-JAK1 group or OE-HOXA10+sh-STAT3 group compared with OE-HOXA10 group).