Figures & data
Figure 1 Study design. The control group (n=6) was treated with SOR without DBB or HIS. The DBB+SOR group (n=6) and the HIS +S OR group (n=6) were treated with SOR with DBB and SOR with HIS.
Abbreviations: SOR, sorafenib; DBB, dried bonito broth; HIS, histidine; CT, computed tomography.
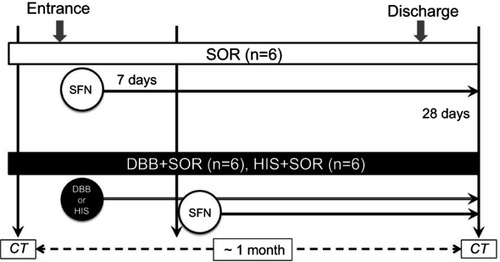
Table 1 Characteristics of the patients
Figure 2 Impact of SOR on normal blood vessels. DSA images of a representative case. (A) before SOR administration and (B) 3 months after SOR administration. 3D images of the vascular structure reconstructed from CT images (C) before SOR administration and (D) 3 months after SOR administration.
Abbreviations: DSA, digital subtraction angiography; SOR, sorafenib; CT, computed tomography; CHA, common hepatic artery; RHA, right hepatic artery; LHA, left hepatic artery; SPA, splenic artery; CA, celiac artery.
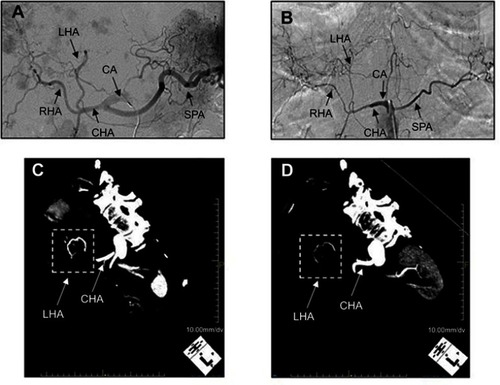
Figure 3 Representative 3D images of vasculature in the SOR, DBB+SOR, and HIS+SOR groups. 3D images of the LHA in the SOR monotherapy group before SOR administration (A) and approximately 1 month after initiation of SOR (B). DBB+SOR group (C and D). HIS+SOR group (E and F).
Abbreviations: LHA, left hepatic artery; SOR, sorafenib; DBB, dried bonito broth; HIS, histidine.
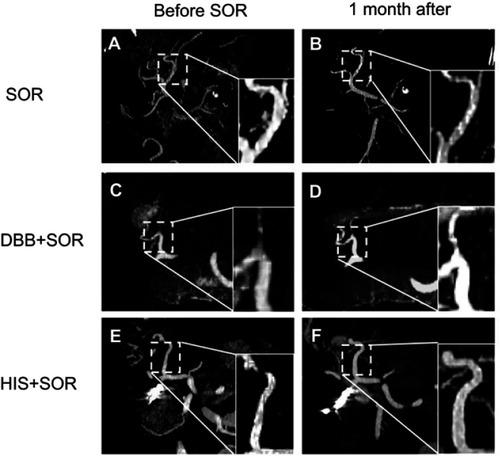
Figure 4 Effect of DBB and HIS on the changes in vascular area dimension caused by SOR. The ratio of vascular area dimension from after to before SOR administration was compared between groups treated with or without DBB or HIS. The values represent means ± SD (n=6 for each group). *P<0.05; **P<0.01; NS, not significant. Kruskal–Wallis test followed by Dunn’s multiple comparison tests.
Abbreviations: CHA, common hepatic artery; RHA, right hepatic artery; LHA, left hepatic artery; SPA, splenic artery; CA, celiac artery; SMA, superior mesenteric artery; RRA, right renal artery; LRA, left renal artery; PV, portal vein; SOR, sorafenib; DBB, dried bonito broth; HIS, histidine.
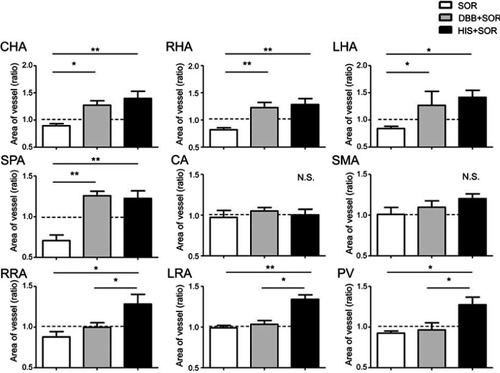
Figure 5 Effect of DBB and HIS on the changes in serum biochemical factors caused by SOR.
Notes: (A–I) Changes in serum biochemical factors from before to after SOR administration were compared between the groups treated with or without DBB or HIS. The values represent means ± SD (n=6 for each group). N.S., not significant, Kruskal–Wallis test followed by Dunn’s multiple comparison tests.
Abbreviations: AST, aspartate aminotransferase; ALT, alanine aminotransferase; TBIL, total bilirubin; TC, total cholesterol; TG, triglycerides; PT, prothrombin time; BUN, blood urea nitrogen; CRE, creatinine; PLT, platelets; SOR, sorafenib; DBB, dried bonito broth; HIS, histidine
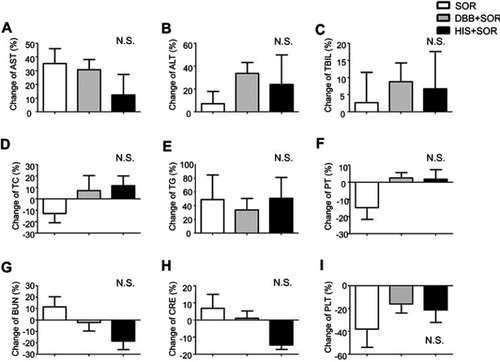
Table 2 Background of serum biochemical analysis
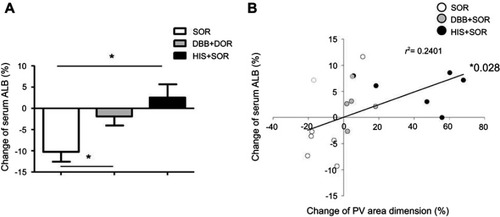
Figure 6 Effect of DBB and HIS on serum ALB level and PV area dimension.
Notes: (A) Changes in serum ALB from the levels before SOR administration were compared between the groups treated with or without DBB or HIS. The values represent means ± SD (n=6 for each group). *P<0.05. Kruskal–Wallis test followed by Dunn’s multiple comparison test. (B) Changes in serum ALB and PV area dimension. The bold black line shows the trend line, and analysis of the correlation between changes in serum ALB and PV area dimension was performed. *P<0.05, Pearson’s correlation test.
Abbreviations: ALB, albumin; PV, portal vein; SOR, sorafenib; DBB, dried bonito broth; HIS, histidine.