Figures & data
Table 1 Characteristics between TP53-mut and TP53-wt groups of patients with TKI treatments (n=71)
Table 2 Univariate analyses of selected factors for PFS and OS of EGFR-mut NSCLC patients (N=71)
Table 3 Multivariate analyses of selected factors for PFS and OS of EGFR-mut NSCLC patients (N=71)
Figure 1 Kaplan–Meier curves of survival. (A) Comparison of PFS between TP53-mut and TP53-wt patients (N=71). (B) Comparison of OS between TP53-mut and TP53-wt subgroups (N=71). (C) Comparison of PFS between TP53-mut and TP53-wt patients in the subgroup of patients with Del19/L8585R EGFR mutations (N=51). (D) Comparison of PFS between TP53-mut and TP53-wt patients in the subgroup of patients with first-line TKIs therapy (N=39).
Abbreviations: PFS, progression-free survival; OS, overall survival; NSCLC, non-small cell lung cancer; ECOG, Eastern Cooperative Oncology Group; PS, performance status; mut, mutant; wt, wild type.
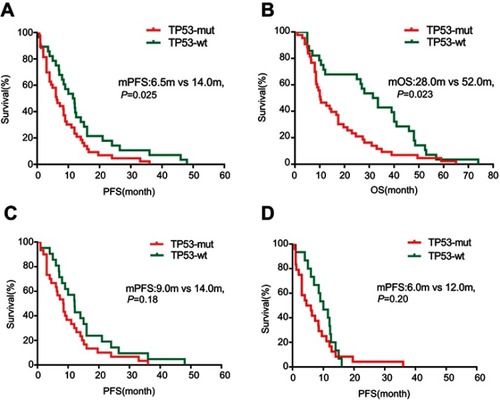
Table 4 Comparison of PFS and OS of patients stratified based on different characteristics
Table 5 TP53 mutational status based on sites and subtypes
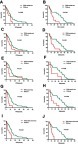
Figure 2 Kaplan–Meier curves of survival. (A and B) Comparison of PFS/OS between patients with TP53 non-disruptive mutations (N=11) and TP53 wild type cases (N=28). (C and D) Comparison of PFS/OS between patients with TP53 non-missense mutations (N=16) and TP53 wild type cases (N=28). (E and F) Comparison of PFS/OS between patients with TP53 mutations in exon 6 (N=6) and TP53 wild type cases (N=28). (G and H) Comparison of PFS/OS between patients with TP53 mutations in exon 7 (N=9) and TP53 wild type cases (N=28). (I and J) Comparison of PFS/OS between patients with TP53 mutations in exons other than 5–8 (N=11) and TP53 wild type cases (N=28).
Abbreviations: PFS, progression-free survival; OS, overall survival.