
Figures & data
Table 1 General characteristics of gastric cancer patients compared with health controls
Figure 1 Expression levels of plasma lncRNAs PANDAR (A), FOXD2-AS1 (B), and SMARCC2 (C) in gastric cancer (GC) and healthy subjects (Normal) evaluated by real-time PCR. *When compared with healthy subjects, a P<0.05 was considered statistically significant.
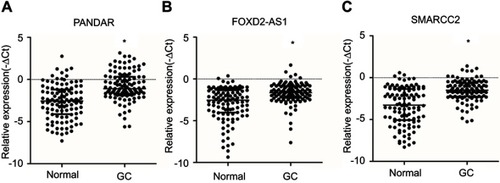
Table 2 Correlation between plasma lncRNAs and clinicopathological parameters of gastric cancer (n=109)
Figure 2 The ROC curves of current biomarkers including CEA, CA153, AFP, CA125, and CA199. (A) The ROC curves of each current biomarker. The area under the curve (AUC) for CEA was 0.661. The AUC for CA153 was 0.589. The AUC for AFP was 0.536. The AUC for CA125 was 0.558. The AUC for CA199 was 0.533. (B) The ROC curve of combined CEA, CA153, AFP, CA125, and CA199. The AUC was 0.709, P<0.001.
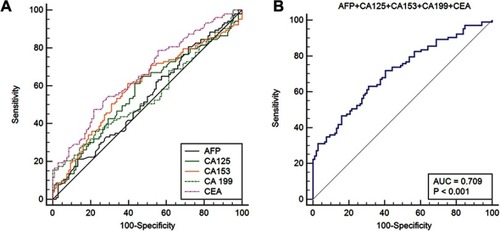
Figure 3 The ROC curves of plasma lncRNAs PANDAR, FOXD2-AS1, and SMARCC2. (A) The ROC curves of each plasma lncRNA. The AUC for PANDAR was 0.767. The AUC for FOXD2-AS1 was 0.700. The AUC for SMARCC2 was 0.748. (B) The ROC curve of combined lncRNAs PANDAR, FOXD2-AS1, and SMARCC2. The AUC was 0.839, P<0.001.
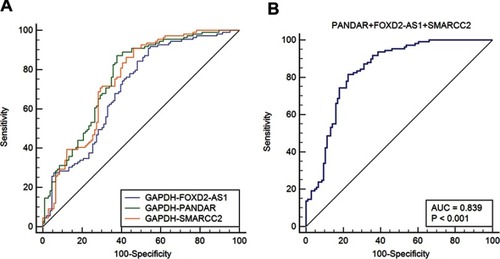
Table 3 Multivariable analysis of risk factors for gastric cancer using logistic regression analysis
Table S1 Primers for lncRNAs