Figures & data
Table 1 Clinical features of patients with nasopharyngeal carcinoma in the training set and validation set
Figure 1 Kaplan–Meier overall survival curves for all 419 patients with NPC in training set stratified by stage (A), N category (B), lymph node site (C), and EBV DNA concentration (D).
Abbreviations: NPC, nasopharyngeal carcinoma
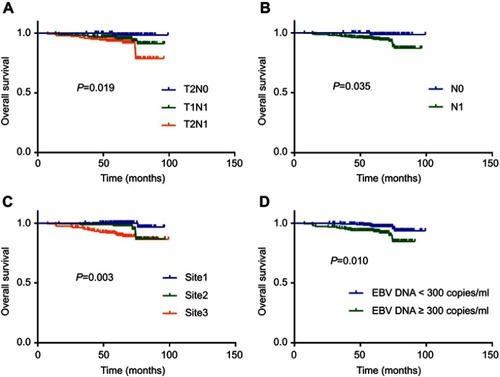
Figure 2 Effect of therapy regimen on survival outcomes. Kaplan–Meier overall survival (A) and progression-free survival (B) curves for all 419 patients with NPC in training set stratified as RT and CCRT group.
Abbreviations: RT, radiotherapy; CCRT, concurrent chemoradiotherapy;
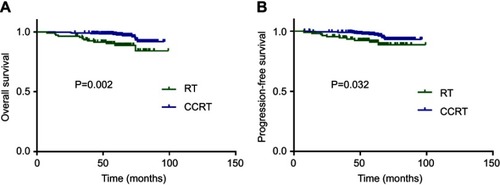
Table 2 Cox’s proportional hazards regression model of overall survival for the 419 patients with nasopharyngeal carcinoma in training set
Figure 3 A nomogram predicts the overall survival (OS) of patients with NPC. This nomogram was based on age, the NLR (neutrophil–lymphocyte ratio), EBV (Epstein–Barr virus) DNA concentration and therapy regimen. The total score of each patient was the sum of the points identified at the top of the scale for each factor and was then identified on the total points scale to determine the probability of 3-year, 5-year, and 6-year OS.

Table 3 The concordance index values for performance of the multivariate model for prediction of OS in the training set and validation set
Figure 4 The calibration curve for predicting overall survival (OS) at 3-, 5-, and 6-year in the training set (A) and validation set (B). Nomogram-predicted OS is plotted on the x-axis; actual rates of OS are plotted on the y-axis. The dashed lines along the 45-degree line through the origin represent the perfect calibration models in which the predicted probabilities are identical to the actual probability.
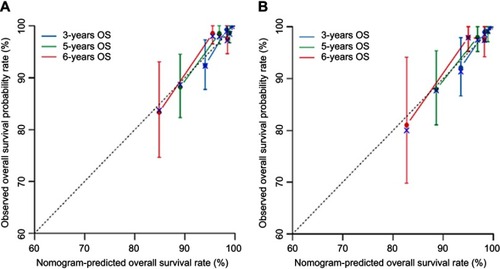
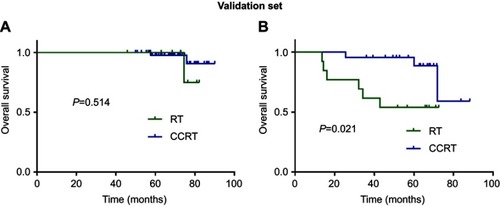
Figure 5 Kaplan–Meier overall survival curves for comparing CCRT vs RT in training set stratified by “low risk” (A) and “high risk” (B).
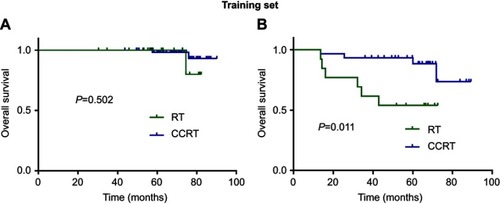
Figure 6 Kaplan–Meier overall survival curves for comparing CCRT vs RT in validation set stratified by “low risk” (A) and “high risk” (B).