
Figures & data
Figure 1 Flow chart of patients included in the UIHC endometrial cancer study cohort. There were 126 patients with endometrial cancer, endometrioid type. 62 had sufficient quantity and quality of purified RNA for RNA sequencing.
Abbreviation: CHA, complex endometrial hyperplasia with atypia; UIHC, University of Iowa Hospitals and Clinics.
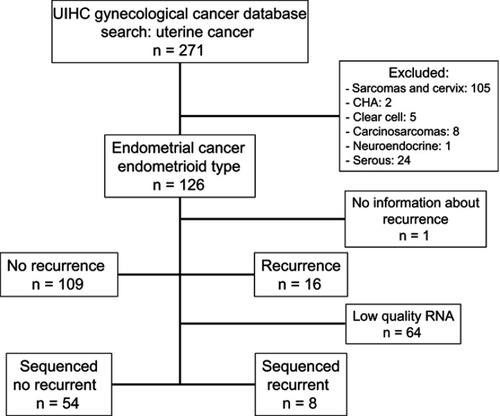
Table 1 Clinical and pathological characteristics of the UIHC cohort of patients included in this study
Figure 2 Representation of differential gene expression (A), miRNA expression (B), somatic mutation (C), and copy number variation (D) by recurrence in the UIHC patient cohort (n=62 patients total; n=8 recurrence and n=54 no recurrence).
Abbreviation: CNV, copy number variation; UIHC, University of Iowa Hospitals and Clinics.
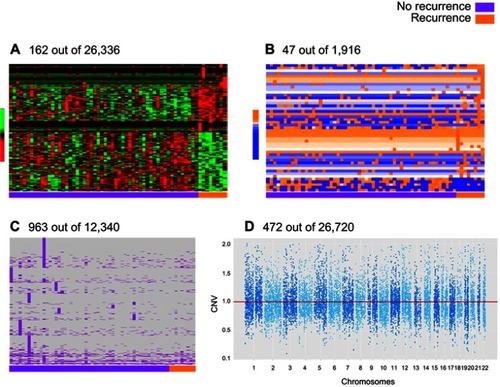
Table 2 Prediction models for recurrence incorporating clinical, pathological and molecular data, as well as external replication of prediction models in TCGA
Table 3 Values for each individual variable used to construct the prediction model score
Table 4 Validation of the prediction model of recurrence in TCGA
Figure S1 Overall survival by recurrence status.
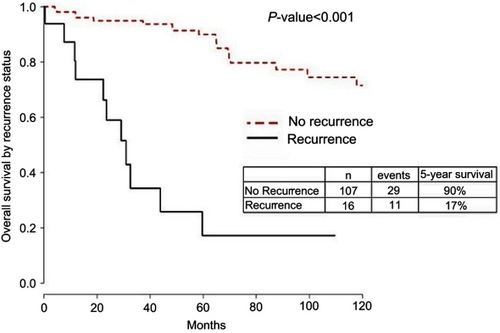
Table S1 TCGA Patient clinical and pathological characteristics (N=394). Univariate analysis with Cox proportional Hazard ratio was used to assess differences between both groups