Figures & data
Figure 1 UBE2T is upregulated in HCC and correlates with clinical features. (A) UBE2T expression was markedly increased in 5 of 6 paired HCC tissues (T) compared with matched non-tumor tissues (N). Total protein as a loading control by staining the membranes with Coomassie brilliant blue. (B) UBE2T expression in human hepatoma cell lines using Western blot. Fetal hepatocyte (FH) cells served as a control. (C) Gray scale of UBE2T expression detected by Western blot in human hepatoma cell lines and FH (n=3). (D) UBE2T mRNA was upregulated in Wurmbach liver from the oncomine database. (E) The correlation of UBE2T and HCC pathological grade in Wurmbach cohort. (F) The correlation of UBE2T and HCC vascular invasion in Wurmbach cohort. (G) High expression of UBE2T was correlated with poor overall survival compared with low expression group in TCGA-LIHC cohort.
Abbreviations: HCC, hepatocellular carcinoma; UBE2T, ubiquitin-conjugating enzyme E2T; GAPDH, glyceraldehyde 3-phosphate dehydrogenase.
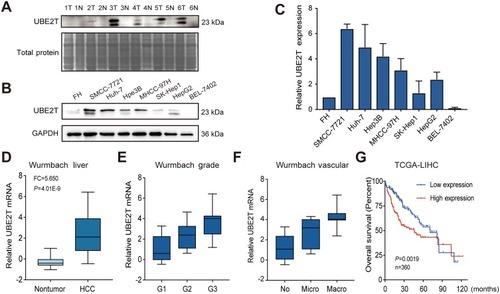
Figure 2 UBE2T modulates HCC cell proliferation. (A) CCK8 assay revealed that knockdown of UBE2T significantly decreased the SMCC-7721 and Huh-7 cell numbers, while overexpression of UBE2T increased the SK-Hep1 and HepG2 cell numbers. (B) In the colony formation assay, downregulation of UBE2T significantly reduced the colony number of hepatoma cells, while upregulation of UBE2T increased colony number of hepatoma cells. (C) In the soft agar colony formation assay, downregulation of UBE2T significantly reduced the colony number of hepatoma cells, while upregulation of UBE2T increased colony number of hepatoma cells. *P<0.05, **P<0.01, ***P<0.001.
Abbreviations: UBE2T, ubiquitin-conjugating enzyme E2T; UBE2T-KD, UBE2T knockdown; UBE2T-OE, UBE2T overexpression; KD-control, control cells transfected with the control vector; OE-control, control cells transfected the empty vector.
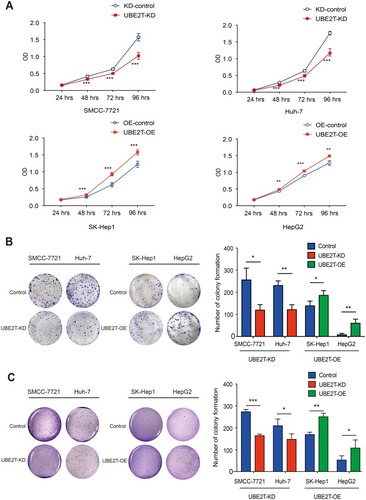
Figure 3 UBE2T accelerates migration and invasion of hepatoma cell lines. (A) UBE2T knockdown significantly inhibited the migration ability, whereas UBE2T overexpression significantly enhanced the migration ability of hepatoma cells using Transwell assay (P<0.01; for 48 hrs after attachment). (B) UBE2T knockdown significantly inhibited invasion ability, whereas UBE2T overexpression significantly enhanced invasion ability of hepatoma cell lines using a Transwell assay (P<0.01; for 48 hrs after attachment). Data are presented as mean±SD. *P<0.05,**P<0.01 versus the control group.
Abbreviations: UBE2T, ubiquitin-conjugating enzyme E2T; UBE2T-KD, UBE2T knockdown; UBE2T-OE, UBE2T overexpression.
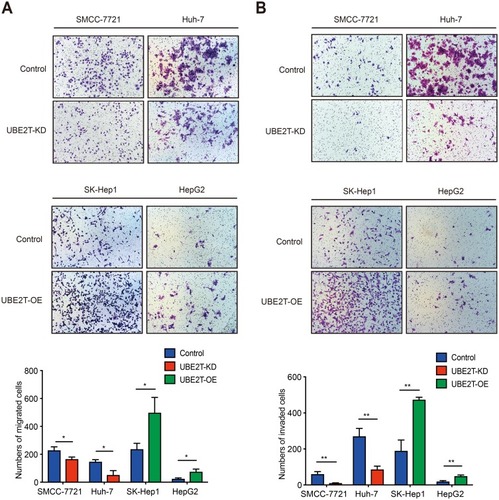
Figure 4 UBE2T regulates the tumorigenesis of HCC. (A) UBE2T-KD (SMCC-7721) cells xenograft tumors formed in nude mice (n=5 per group); (B) tumors were collected 21 days after xenotransplantation. (C) Comparison of tumor weight in control group and UBE2T-KD group; (D) UBE2T-KD (SMCC-7721) and control cell line KD-control growth curve of subcutaneous tumor volume in nude mice (measured once every 3 days, measuring maximum diameter a and minimum diameter b, respectively, calculating tumor volume according to formula V=a×b2/2); (E) subcutaneous inoculation in nude mice post-cell weight change curve (measured once every 3 days); (F) qPCR results for detection for mRNA level of UBE2T in xenograft tumors; (G) Western blots results for detection for UBE2T in xenograft tumors, N: KD-control, S: UBE2T-KD. (H) Immunohistochemical detection of UBE2T interference on tumor proliferation marker Ki-67 (200×). GAPDH was used as internal control. The statistical data are expressed as mean±SEM, compared with the control group, **P<0.01, ***P<0.001.
Abbreviations: HCC, hepatocellular carcinoma; UBE2T, ubiquitin-conjugating enzyme E2T; GAPDH, glyceraldehyde 3-phosphate dehydrogenase; UBE2T-KD, UBE2T knockdown; KD-control, control cells transfected with the control vector.
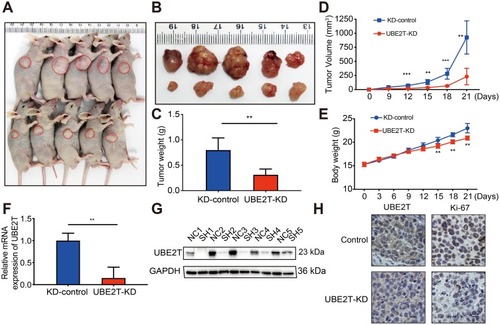
Figure 5 UBE2T is involved in cell cycle G2-to-M transition. (A) Flow cell count detection cell cycle representative analysis map. (B) Cell cycle G1, S, G2/M phase ratio histogram. UBE2T-KD: UBE2T stable interfering cell line; UBE2T-OE: UBE2T stable overexpressing cell line. *P<0.05, **P<0.01, ***P<0.001.
Abbreviations: UBE2T, ubiquitin-conjugating enzyme E2T; UBE2T-KD, UBE2T knockdown; UBE2T-OE, UBE2T overexpression; KD-control, control cells transfected with the control vector; OE-control, control cells transfected the empty vector.
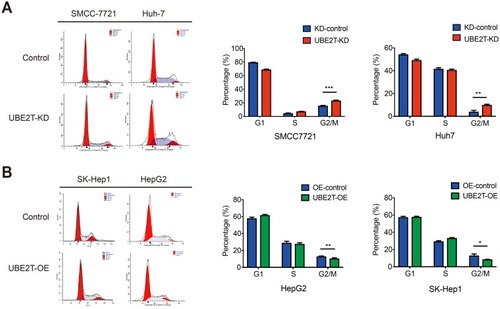
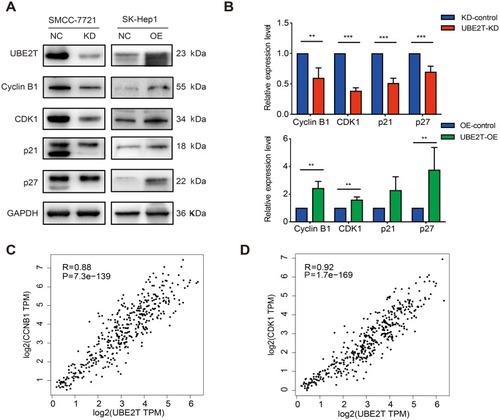
Figure 6 UBE2T regulates G2-to-M transition by modulating cyclin B1 and CDK1. (A) Immunoblot assay for expression of cell-cycle-associated factors in UBE2T-KD (SMCC-7721) and UBE2T-OE (SK-Hep1) cell lines. (B) The quantitative expression ratio of protein expression of UBE2T-KD and UBE2T-OE relative to control group. GAPDH was used as internal control, and the experiment was repeated at least three times independently. UBE2T-KD: UBE2T stable interference cells; UBE2T-OE: UBE2T stable overexpression cells. (C) There was a significant positive correlation between UBE2T and CCNB1 expression, Spearman correlation coefficient R=0.88, P=7.3e-139. (D) UBE2T was significantly positively correlated with CDK1 expression, Spearman correlation coefficient R=0.92, P=1.7e-169. **P<0.01, ***P<0.001.
Abbreviations: UBE2T, ubiquitin-conjugating enzyme E2T; UBE2T-KD, UBE2T knockdown; UBE2T-OE, UBE2T overexpression; KD-control, control cells transfected with the control vector; OE-control, control cells transfected the empty vector; CDK1, cyclin-dependent kinase 1.