
Figures & data
Figure 1 miR-34a suppressed the proliferation and colony formation of Hep3B and SNU-449. Relative inhibition rates of Hep3B (A) and SNU-449 (B) in response to miR-34a, and mock group were calculated by comparing the OD value of miR-34a mimic or mock to NC, at 48, 72, 96, and 120 hrs, respectively. The representative colony formation of SNU-449 (C) and Hep3B (D) cells transfected by miR-34a and control mimics. The relative colony formation efficiency also showed significant reduction of amount of colonies of SNU-449 and Hep3B (E) in miR-34a mimic groups. Data are presented as the mean±SD (miR-34a mimic vs control mimic).
Abbreviation: NS, non-significant.
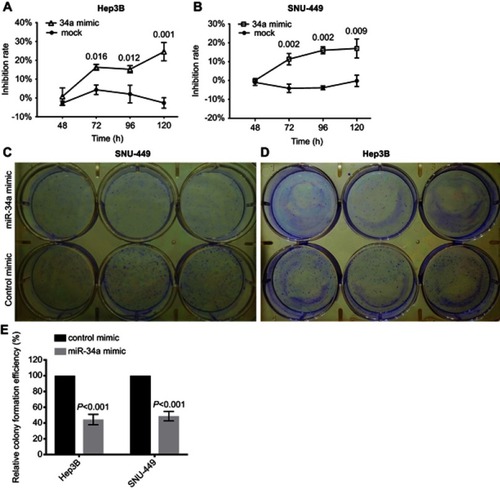
Figure 2 miR-34a inhibited the migration and invasion ability of SNU-449 and Hep3B cells. The wound healing assay was made in Hep3B (A) and SNU-449 (C) transfected with miR-34a mimic or control mimic at 0, 24, and 48 hrs, respectively. The bar graphics present the percentage of wound recovery in Hep3B (B) and SNU-449 (D). We can observe that control mimic stimulated cells to close the wound faster than miR-34a. Transwell invasion assay for SNU-449 (E) and Hep3B (G) cells transfected by miR-34a, control mimic group and mock, and images were taken after 24 and 48-hr incubation, respectively. The average cell number was counted by three randomly chosen different fields in SNU-449 (F) and Hep3B cells (H). Values represent the mean±SD.
Abbreviation: NS, non-significant.
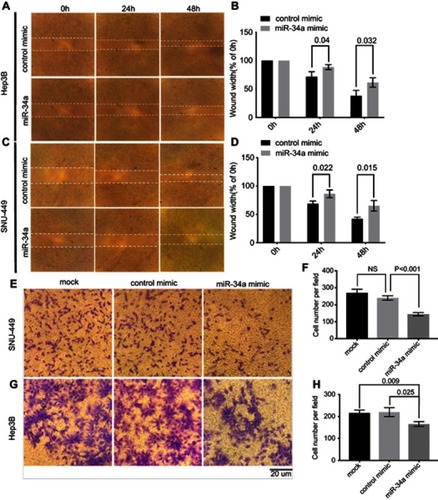
Figure 3 miR-34a inhibited the spheroid formation of Hep3B and SNU-449 cells. The representative 3D spheroid models of Hep3B (A) and SNU-449 cells (B) transfected by miR-34a and control mimics. The relative cross-sectional area showed significant reduction of Hep3B (C) and SNU-449 spheroid (D) in miR-34a mimic groups. Relative inhibition rates of Hep3B and SNU-449 spheroid formation (E) in response to miR-34a were calculated by dividing the fluorescence value of miR-34a mimic by that of control mimic at 24, 48, 72, and 96 hrs, respectively.
Abbreviation: NS, not-significant.
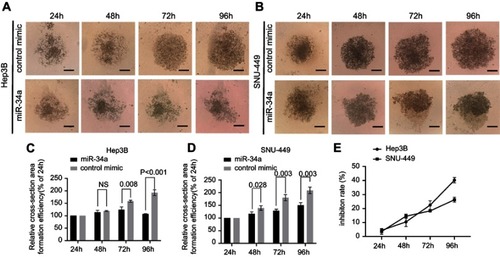
Figure 4 E2F1 and E2F3 were downregulated by miR-34a overexpression. E2F3 3ʹ-UTR contains a predicted binding site of miR-34a (A). The relative expression level of E2F1 (B) and E2F3 (C) in HCC cells.
Abbreviations: HCC, hepatocellular carcinoma; NS, non-significant.
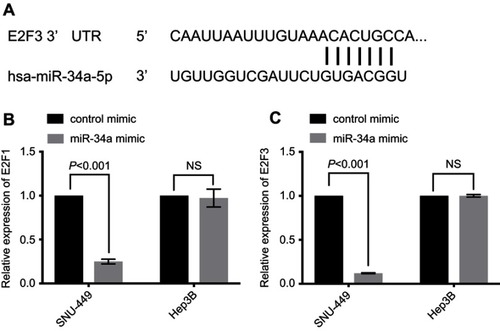
Figure 5 miR-34a improved CASP3 activity. The absorbance was higher in the miR-34a group than NC, apoptosis inhibited NC and apoptosis inhibited miR-34a group in Hep3B (A) and SNU-449 (B), respectively. (C) CASP3-specific activities were significantly higher in miR-34a treated group compared to NC in both cell lines.
Abbreviations: NC, negative control; NS, non-significant.
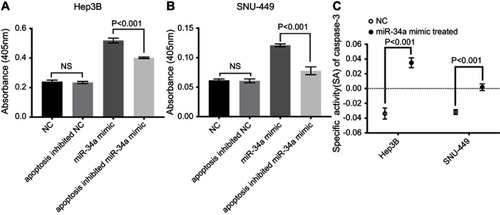
Figure 6 Meta-analysis of the differential expression of E2F1 and E2F3, and the Kaplan–Meier survival curves of E2F1, E2F3, and miR-34a in HCC. Meta-analysis for the differential expression of E2F1 (A) and E2F3 (B) in primary HCC tissues (N cases) compared to normal tissues (N control), respectively, with a random-effects model (CI; I-squared measures the degree of heterogeneity in meta-analyses). HCC patients with either high E2F1 (C), or high E2F3 (D), or low miR-34a (E) had an inferior overall survival compared to those with either low E2F1, or low E2F3, or high miR-34a, respectively.
Abbreviation: HCC, hepatocellular carcinoma.
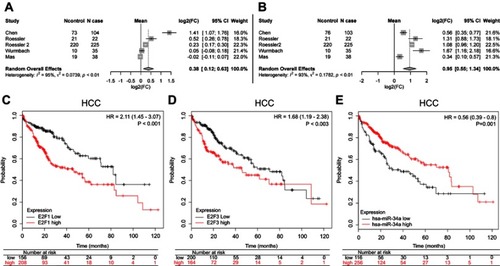
Table S1 Oligo primer sequences of genes in this study
Table S2 Characteristics of populations and cancer types of the studies included in the meta-analysis