Figures & data
Figure 1 Study flow diagram of inclusion.
Abbreviations: PD-1, programmed cell death 1; PD-L1, Programmed death-ligand 1; SCLC, small cell lung cancer; NSCLC, non-small cell lung cancer.
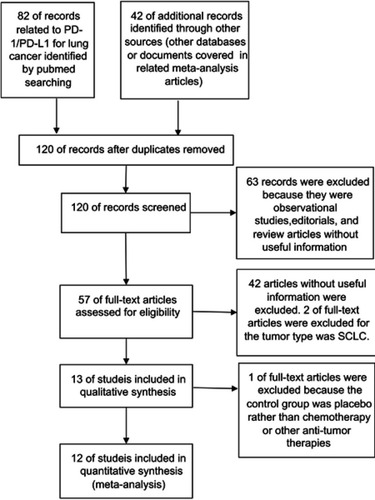
Table 1 Basic characteristics of enrolled studies
Figure 2 (A): Risk of bias summary: review authors’ judgments about each risk of bias item for each included study. (B): Risk of bias graph: review authors’ judgments about each risk of bias item presented as percentages across all included studies.
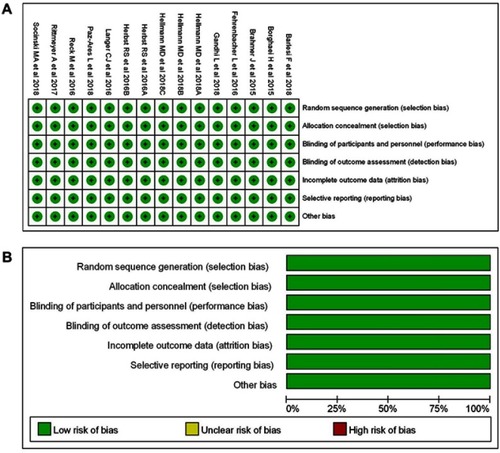
Figure 3 Forest plots of the incidence risk for all-grade diarrhea. (A1): OR of diarrhea for all grades in the subgroup analysis (PD-1/PD-L1 vs chemotherapy). (A2): OR of diarrhea for all grades in the subgroup analysis (PD-1/PD-L1 vs docetaxel/combined chemotherapy), the data included were assigned to the corresponding subgroup according to control group (docetaxel or combined chemotherapy). (A3): OR of diarrhea for all grades in the subgroup analysis (PD-1/PD-L1 vs chemotherapy), the data included were assigned to the corresponding subgroup according to the name of PD-1/PD-L1 inhibitor and the control group. (B): OR of diarrhea for all grades in the subgroup analysis (PD-1/PD-L1 + chemotherapy vs chemotherapy).
Abbreviation: RE, random effect; PD-1, programmed cell death 1; PD-L1, programmed cell death ligand 1;.
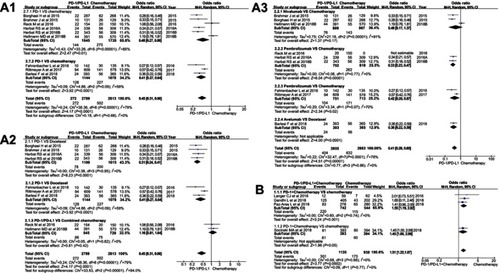
Figure 4 Forest plots of the incidence risk for grade 1–2 diarrhea. (A1): OR of diarrhea for grade 1–2 in the subgroup analysis (PD-1/PD-L1 vs chemotherapy) (A2): OR of diarrhea for grade 1–2 in the subgroup analysis (PD-1/PD-L1 vs docetaxel/combined chemotherapy), the data included were assigned to the corresponding subgroup according to control group (docetaxel or combined chemotherapy). (A3): OR of diarrhea for grade 1–2 in the subgroup analysis (PD-1/PD-L1 vs chemotherapy), the data included were assigned to the corresponding subgroup according to the name of PD-1/PD-L1 inhibitor and the control group. (B): OR of diarrhea for grade 1–2 in the subgroup analysis (PD-1/PD-L1 + chemotherapy VS chemotherapy).
Abbreviation: PD-1, programmed cell death 1; PD-L1, programmed cell death ligand 1; RE, random effect.
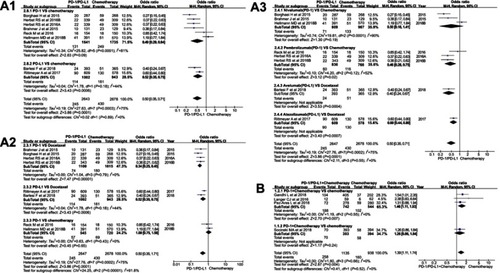
Figure 5 Forest plots of the incidence risk for grade 3–5 diarrhea. (A1): OR of diarrhea for grade 3–5 in the subgroup analysis (PD-1/PD-L1 vs chemotherapy) (A2): OR of diarrhea for grade 3–5 in the subgroup analysis (PD-1/PD-L1 vs docetaxel/combined chemotherapy), the data included were assigned to the corresponding subgroup according to control group (docetaxel or combined chemotherapy). (A3): OR of diarrhea for grade 3–5 in the subgroup analysis (PD-1/PD-L1 vs chemotherapy), the data included were assigned to the corresponding subgroup according to the name of PD-1/PD-L1 inhibitor and the control group. (B): OR of diarrhea for grade 3–5 in the subgroup analysis (PD-1/PD-L1 + chemotherapy vs chemotherapy).
Abbreviation: PD-1, programmed cell death 1; PD-L1, programmed cell death ligand 1; RE, random effect.
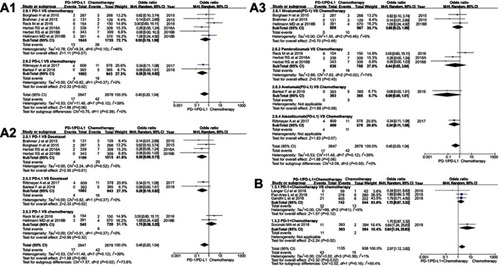
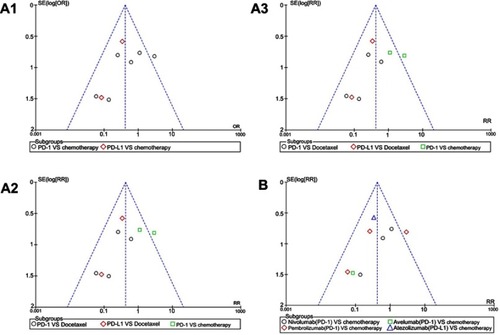
Figure S1 Funnel plots of the incidence risk for all-grade diarrhea. (A1): Funnel plots of diarrhea for all grades in the subgroup analysis (PD-1/PD-L1 vs chemotherapy). (A2): Funnel plots of diarrhea for all grades in the subgroup analysis (PD-1/PD-L1 vs docetaxel/combined chemotherapy), the data included were assigned to the corresponding subgroup according to control group (docetaxel or combined chemotherapy). (A3): Funnel plots of diarrhea for all grades in the subgroup analysis (PD-1/PD-L1 vs chemotherapy), the data included were assigned to the corresponding subgroup according to the name of PD-1/PD-L1 inhibitor and the control group. (B): Funnel plots of diarrhea for all grades in the subgroup analysis (PD-1/PD-L1 + chemotherapy vs chemotherapy).
Abbreviation: PD-1, programmed cell death 1; PD-L1, programmed cell death ligand 1; OR, odds ratio; RR, risk ratio.
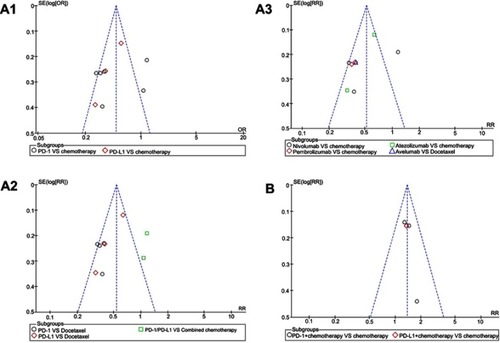
Figure S2 Funnel plots of the incidence risk for grade 1–2 diarrhea. (A1): Funnel plots of diarrhea for grade 1–2 in the subgroup analysis (PD-1/PD-L1 vs chemotherapy). (A2): Funnel plots of diarrhea for grade 1–2 in the subgroup analysis (PD-1/PD-L1 vs docetaxel/combined chemotherapy), the data included were assigned to the corresponding subgroup according to control group (docetaxel or combined chemotherapy).(A3): Funnel plots of diarrhea for grade 1–2 in the subgroup analysis (PD-1/PD-L1 vs chemotherapy), the data included were assigned to the corresponding subgroup according to the name of PD-1/PD-L1 inhibitor and the control group. (B): Funnel plots of diarrhea for grade 1–2 in the subgroup analysis (PD-1/PD-L1 + chemotherapy vs chemotherapy).
Abbreviation: PD-1, programmed cell death 1; PD-L1, programmed cell death ligand 1; OR, odds ratio; RR, risk ratio.
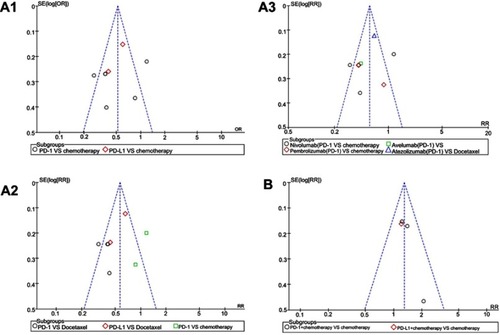
Figure S3 Funnel plots of the incidence risk for grade 3–5 diarrhea. (A1): Funnel plots of diarrhea for grade 3–5 in the subgroup analysis (PD-1/PD-L1 vs chemotherapy). (A2): Funnel plots of diarrhea for grade 3–5 in the subgroup analysis (PD-1/PD-L1 vs docetaxel/combined chemotherapy), the data included were assigned to the corresponding subgroup according to control group (docetaxel or combined chemotherapy). (A3): Funnel plots of diarrhea for grade 3–5 in the subgroup analysis (PD-1/PD-L1 VS chemotherapy), the data included were assigned to the corresponding subgroup according to the name of PD-1/PD-L1 inhibitor and the control group. (B): Funnel plots of diarrhea for grade 3–5 in the subgroup analysis (PD-1/PD-L1 + chemotherapy vs chemotherapy).
Abbreviation: PD-1, programmed cell death 1; PD-L1, programmed cell death ligand 1; OR, odds ratio; RR, risk ratio.