Figures & data
Table 1 Patient’s characteristics
Figure 1 The representative white light, LCI, BLI and H&E histological sections of LGIN, HGIN, and EGC.
Abbreviations: BLI, Blue Laser Imaging; EGC, early-stage gastric cancer; HGIN, High-grade Intraepithelial neoplasia, LCI, Linked Color Imaging; LGIN, Low-grade Intraepithelial neoplasia.
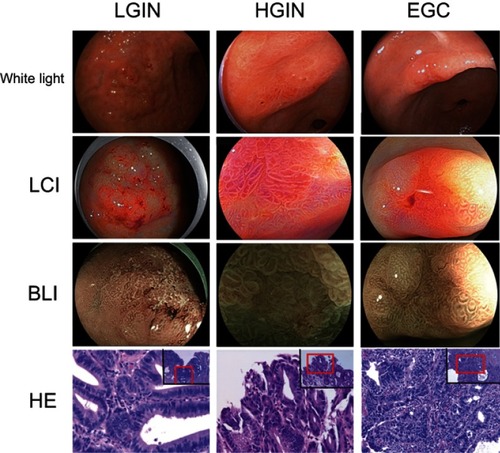
Figure 2 The expression of PD-L1 and its association with stage in LGIN, HGIN, and EGC. (A–H) The representative expression of PD-L1 in LGIN (A, B, E, F), HGIN+EGC (C, D, G, H); shown at ×100 (A, C, E, G) and ×400 (B, D, F, H) original magnification; (I) The correlation between stage and PD-L1 expression, which was determined using χ2 test; (J) The correlation between the depth of invasion and PD-L1 expression, which were also determined using the Spearman’s rank correlation coefficient test.
Note: **P<0.01.
Abbreviations: EGC, early-stage gastric cancer; HGIN, High-grade Intraepithelial neoplasia; LGIN, Low-grade Intraepithelial neoplasia; NS, not statistically significant; PD-L1, programmed death-ligand 1.
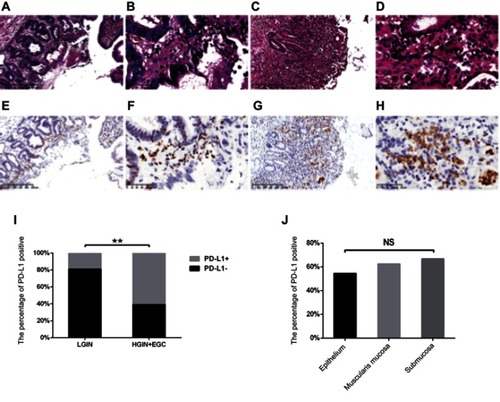
Figure 3 The expression of PD-1 and its association with stage in LGIN, HGIN, and EGC. (A–H) Representative expression of PD-1 in LGIN (A, B, E, F), HGIN+EGC (C, D, G, H), shown at ×100 (A, C, E, G) and ×400 (B, D, F, H) original magnification; (I) The correlation between stage and PD-1 expression, which were determined using χ2 test; (J) The correlation between the depth of invasion and PD-1 expression, which were also determined using the Spearman’s rank correlation coefficient test.
Note: *P<0.05.
Abbreviations: EGC, early-stage gastric cancer; HGIN, High-grade Intraepithelial neoplasia; LGIN, Low-grade Intraepithelial neoplasia; NS, not statistically significant; PD-1, programmed death-1.
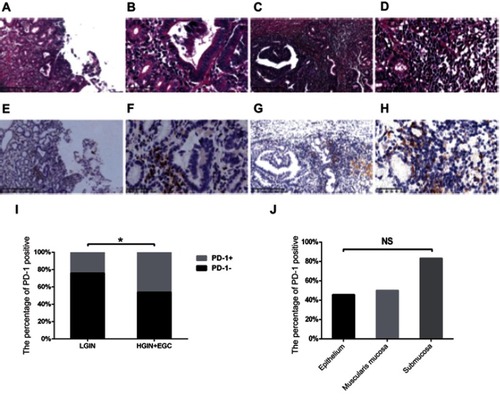
Figure 4 Representative flow expression of PD-1 on CD4+ T-cell and CD8+ T-cell in the normal gastric mucosa and in HGIN. (A) The representative flow expression of PD-1 and its isotype on CD4+ T-cell and CD8+ T-cell in normal gastric mucosa; (B) The representative flow expression of PD-1 and its isotype on CD4+ T-cell and CD8+ T-cell in HGIN.
Abbreviations: HGIN, High-grade Intraepithelial neoplasia; PD-1, programmed death-1.
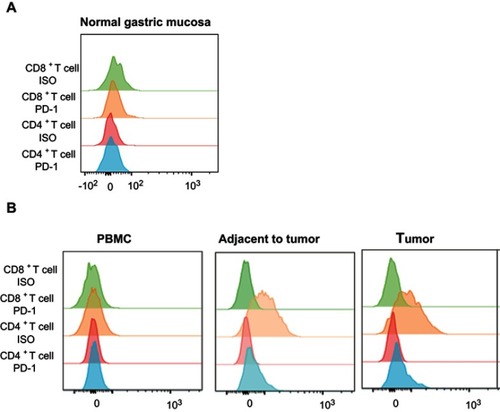
Figure 5 The CD8 density and its association with PD-L1 expression in LGIN, HGIN, and EGC. (A) The representative intratumoral, tumor–stromal interface expression of CD8 in LGIN, HGIN, and EGC; (B) The correlation between stage and CD8 density; (C) CD8 density is more in tumor–stromal interface than in tumor (P=0.0005); (D, E) PD-L1 is not associated with increasing CD8 density whatever in tumor–stromal interface and in tumor; CD8 density within LGIN, HGIN, and EGC was determined and densities were divided by quartiles into low (<147/mm2), mid (147–500/mm2), and high (>500/mm2). Correlation between CD8 density and PD-L1 expression by location were determined using the exact version of the Cochran–Armitage trend test.
Note: *** P<0.001.
Abbreviations: EGC, early-stage gastric cancer; HGIN, High-grade Intraepithelial neoplasia; LGIN, Low-grade Intraepithelial neoplasia; NS, not statistically significant; PD-L1, programmed death-ligand 1.
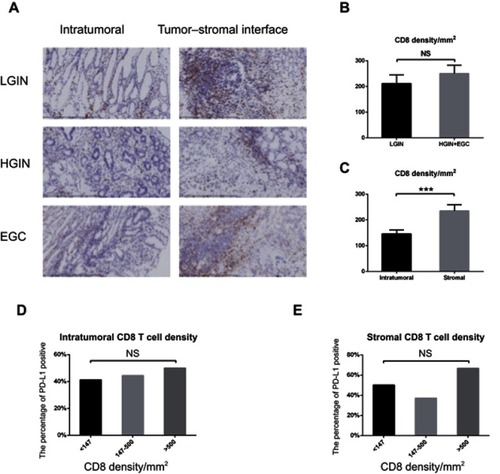
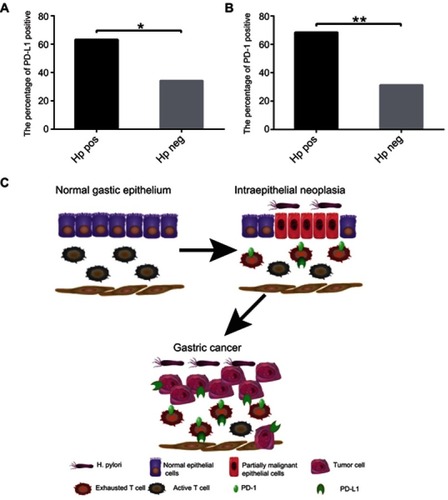
Figure 6 The relationship between Hp infection and PD-1, PD-L1 expression. (A) The percentage of PD-L1 positive in patients with Hp positive and negative; (B) The percentage of PD-1 positive in patients with Hp positive and negative. (C) Pattern diagram: Under chronic infection caused by Hp, the immune system may cause excessive damage of normal tissues. In order to avoiding excessive damage, PD-L1/PD-1 checkpoint inhibition is upregulated, but also reduces the tumor killing effect of T-cells and promotes the progress of gastric cancer.
Note: *P<0.05 and **P<0.01.
Abbreviations: Hp, Helicobacter pylori; PD-1, programmed death-1; PD-L1, programmed death-ligand 1.