
Figures & data
Table 1 Patient and tumor characteristics (n = 662)
Table 2 Risk factors in different FIGO 2018 stages
Table 3 Distribution of stages by FIGO 2009 and FIGO 2018 criteria
Figure 1 (A and B) PFS and OS curves for 2018 FIGO stages. (C and D) PFS and OS curves for patients with different numbers of metastatic PLNs.
Abbreviations: OS, overall survival; PFS, progress-free survival; RT, radiotherapy; FIGO, International Federation of Gynecology and Obstetrics; PLN, pelvic lymph node.
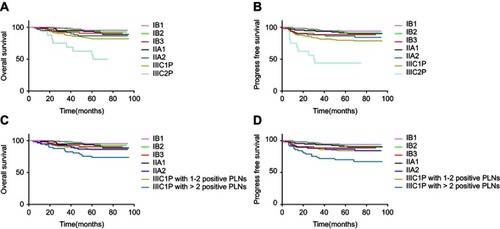
Table 4 Results of univariate analysis
Table 5 Results of multivariate analysis