
Figures & data
Figure 1 IRF6 expression is elevated in breast cancer tissues and breast cell lines. (A and B) The mRNA expression levels of IRF6 in breast cell lines were determined by RT-qPCR and agarose gel electrophoresis. (C) The protein levels of IRF6 in breast cancer cell lines and non-cancerous breast cell lines were confirmed by immunoblotting analysis; GAPDH was used as a normalized control. (D) The mRNA expression levels of IRF6 in breast cancer tissues and non-cancerous breast tissues were determined by RT-qPCR. Student’s t-test, *p<0.05.
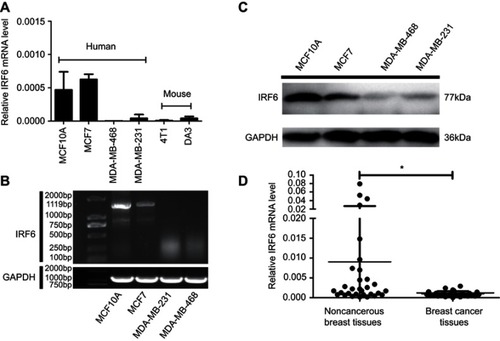
Figure 2 Regulation of IRF6 expression affects growth in breast cancer cells in vitro and in vivo. (A and D) Transient suppression and overexpression of IRF6 in breast cancer cells were determined by RT-qPCR and immunoblotting analysis, GAPDH was used as the normalized control. (B and E) Cell proliferation was measured by the MTS assay with 1% FBS culture medium. (C and F) Colony formation assays were performed following the overexpression or suppression of IRF6; representative photos and a quantification chart of cells stained with 1% crystal violet are shown. (G) Subcutaneous injection of IRF6-overexpressing cells and vector control cells into nude mice. (H) The growth curve shows MDA-MB-231 growth suppression following IRF6 overexpression in vivo. (I) The total tumor weights were lower following injection with IRF6-overexpressing cells than injection with vector control cells. Student’s t-test, data represent the mean±SD; *p<0.05, **p<0.01, ***p<0.001.
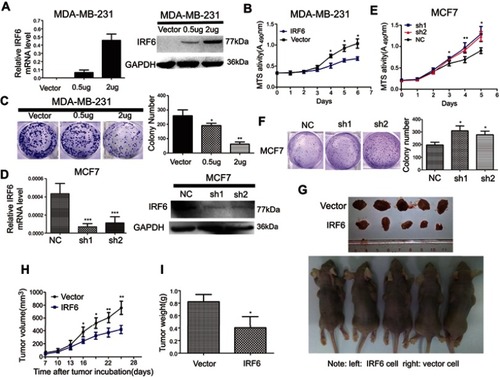
Figure 3 IRF6 enhances dose-dependent sensitivity to cisplatin (CDDP) and suppresses the breast tumorigenicity. (A) The cells were seeded with different doses of cisplatin. Representative photos and the survival index of the formed colonies are presented. Student’s t-test, *p<0.05. (B) The cells treated with increasing doses of cisplatin followed by Western blotting analysis of caspase-3 and cleaved caspase-3 expression. (C) Images (left panel) and quantification of the number of oncospheres (right panel) formed in transiently transfected cell lines in DMEM/F12 medium with a 20 ng/mL concentration of FGF and EGF for 6–7 days. Student’s t-test, **p<0.01. (D) Tumorigenesis abilities: stabled IRF6-overexpressing cells in five cell concentrations were injected subcutaneously into the right and left armpits of nude mice and observed for 20 days. The tumor formation rates in different groups are shown and the right upper panel shows photographs of their respective isolated tumors.
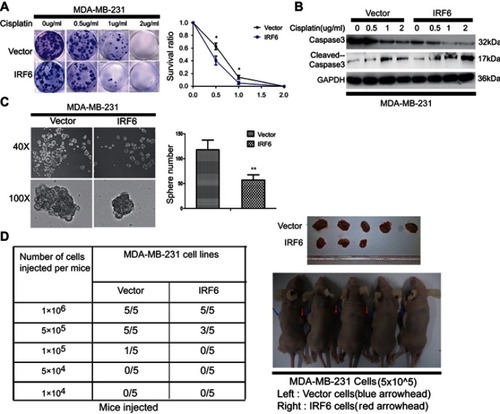
Figure 4 RNA-Seq and KEGG analysis revealed IRF6 downregulates the expression of the PIK3R2 gene, a PI3K regulatory subunit that is comprehensively involved in many cancer-related signaling pathways. (A) Non-supervised clustering of all DEGs. The heatmap represents the mRNA K-means clustering of log10-transformed expression value differences between IRF6-overexpressing and vector cells. Red represents increased expression, and blue represents reduced expression. (B) Gene expression profiling was performed on IRF6overexpressing and vector cells lines. Here presentation of part of the distinctly upregulated and down-regulated genes in IRF6-overexpressing cell lines relative to the vector cell lines. Red, the gene has increased expression in IRF6-overexpressing cell lines compared to the vector cell lines. Blue, the gene has decreased expression. The red box indicates the gene PIK3R2 (p85β). (C) A scatter diagram including RNA-Seq and RT-qPCR data from correlation analysis including 5 genes: IRF6, PIK3R2, NR3C2, CST2, FOXP2. Pearson’s analysis, r2=−0.9774; p=0.0015. (D) Pathway analysis showed that 20 pathways were dramatically enriched; the numbers for each pathway were based on Fisher’s exact test, indicating the fold enrichment. The red outline box indicates that the gene PIK3R2 (p85β) participated in the corresponding pathway, such as regulation of actin cytoskeleton, cholinergic synapse, toll-like receptor signaling pathway, and phosphatidylinositol signaling system. The blue outline box indicates the phosphatidylinositol signaling system, which contains the PI3K/Akt signaling pathway.
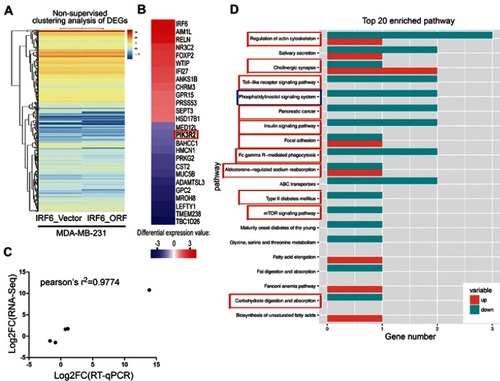
Figure 5 IRF6-mediated PIK3R2 expression modulates PI3K/AKT pathway to involve in breast cancer pathogenesis. (A) The mRNA expression levels of PIK3R2 in breast cancer and non-cancerous breast cancer tissues were determined by RT-qPCR. (B) PIK3R2mRNA levels were negatively correlated with IRF6 expression in breast cancer tissues as assessed by RT-qPCR (Pearson’s analysis, r=−0.4228; p<0.05). (C) Protein expression levels of p-AKT, AKT, and CD44 in MCF7 and MDA-MB-231 cells were assessed by immunoblotting analysis. GAPDH was used as a reference control. (D) Effect of IRF6 on the expression level of proteins involved in p85β-activated AKT signaling cascades. For the immunoblot analysis of IRF6, p85β, p-AKT, AKT, p-mTOR and mTOR in transient overexpression or suppression of IRF6 cell lines. GAPDH was used as a loading control. (E–G) MDA-MB-231 cells were supplemented with increasing doses of an AKT inhibitor (LY294002) and calculated the number of spheres generated between cells seeded with LY294002 and DMSO. (H and I) IRF6 knockdown cells (sh1) and shRNA control cells treated with DMSO vehicle control and increasing doses of an AKT inhibitor (LY294002); compared to control cells, sh1 cells showed increased sensitivity to LY294002. Data represent the mean±SD, *p<0.05,**p<0.01.
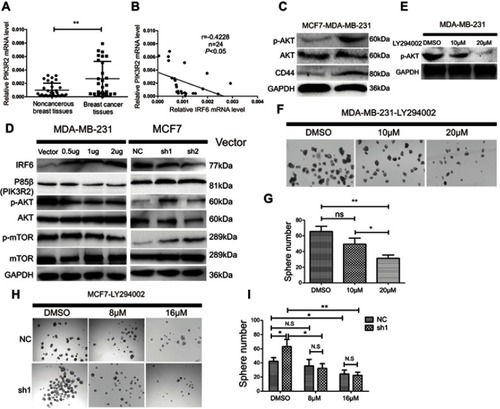
Figure 6 Schematic depiction. Schematic representation of IRF6-mediated PIK3R2 expression modulation of the phosphatidylinositol-3-kinase (PI3K)/protein kinase B (AKT)/mammalian target of rapamycin (mTOR) pathway.
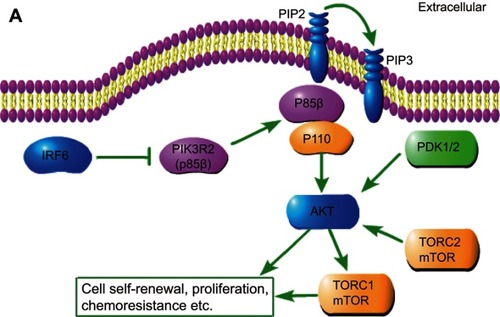
Figure S1 Knockdown of IRF6 reduces the dose-dependent sensitivity to cisplatin in breast cancer. (A) IRF6-knockdown cells and scramble cells were seeded with different doses of cisplatin. Representative photos and the survival index of the formed colonies were presented. Student’s t-test, *p<0.05. (B) The cells were treated with 0.2 μg/mL cisplatin followed by Western blotting analysis of caspase-3 and cleaved caspase-3 expression.
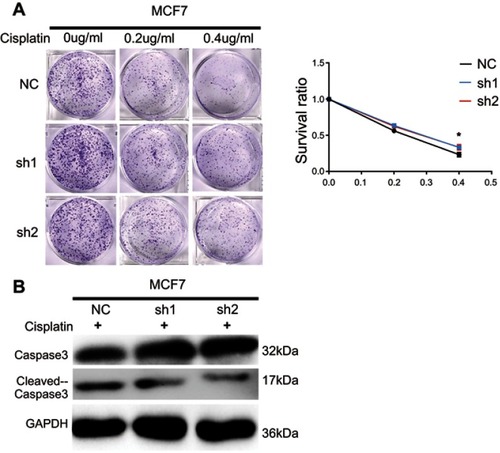
Table S1 The sequences of the PCR primer are listed
Table S2 The description of parts of DEGs