Figures & data
Figure 1 FAM83D is overexpressed in human GC. (A) FAM83D mRNA expression in liver cancer tissues is higher than normal tissues from ONCOMINE database. Dataset 1, Diffuse Gastric Adenocarcinoma vs Normal, Chen Gastric; Dataset 2, Gastric Intestinal Type Adenocarcinoma vs Normal, Chen Gastric; Dataset 3, Diffuse Gastric Adenocarcinoma vs Normal, Cho Gastric; Dataset 4, Gastric Intestinal Type Adenocarcinoma vs Normal, Cho Gastric; Dataset 5, Gastric Mixed Adenocarcinoma vs Normal Cho Gastric; Dataset 6, Gastric Cancer vs Normal, Cui Gastric; Dataset 7, Gastric Intestinal Type Adenocarcinoma vs Normal, DErrico Gastric; Dataset 8, Gastric Cancer vs Normal, Wang Gastric. Cell color and the number above the cell in the lower panel indicate the best gene rank percentile for the analysis. Red, upregulated; blue, downregulated. (B) The prognostic value of FAM83D mRNA expression in gastric cancer (www.oncolnc.org). (C) The prognostic value of FAM83D mRNA expression in gastric cancer (www.kmplot.com). (D) The mRNA levels of FAM83D from 33 patients were tested by quantitative PCR using paired t-test. (E) FAM83D protein expressions in seven GC cell lines (NCL-N87, BGC-823, AGS, SGC-7901, KATO III, MKN-45, SNU-1), one immortalized gastric cell line (GES-1, Hs 738.St/Int) were examined by Western blotting.
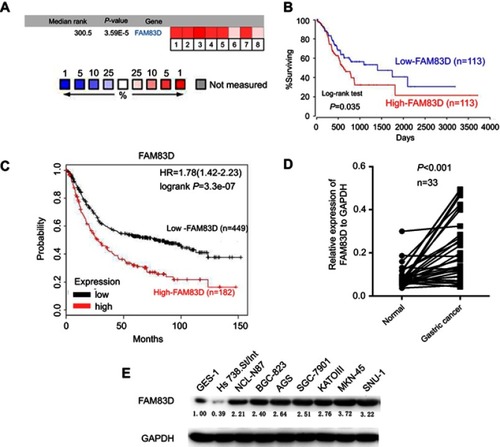
Table 1 Association between FAM83D expression and clinicopathologic factors in 360 GC specimens
Figure 2 Upregulation of FAM83D is associated with poor prognosis in gastric cancer. (A) and (B), low expression of FAM83D in normal gastric specimen. (C) and (D), low expression of FAM83D in gastric carcinoma. (E) and (F), high expression of FAM83D in gastric carcinoma. The scale bar is 100 μm. (G) FAM83D staining was quantified (***p<0.001, compared with normal tissues). (H) FAM83D expression was associated with overall survival (OS) (n=291, p<0.001) (I) FAM83D expression was associated with disease-free survival (DFS) (n=291, p<0.001).
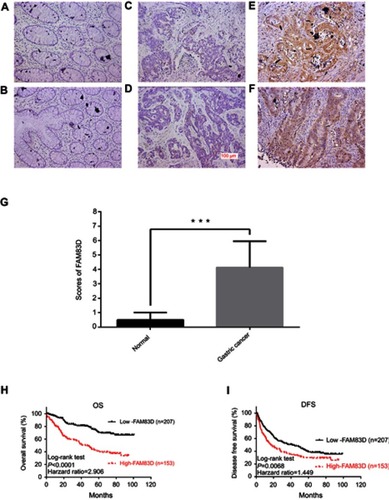
Table 2 Univariate and multivariate analysis of overall survival in 360 GC specimens
Figure 3 FAM83D promotes proliferation and clonogenicity of GC cells. (A) The effect of FAM83D knockdown with siRNAs was verified by Western blotting 48 hrs after transfection. (B) The effect of FAM83D overexpression was verified by Western blotting. (C) Viability of FAM83D knockdown cells was assessed with an MTT assay at indicated times. (D) Viability of FAM83D overexpression cells was assessed with an MTT assay at indicated times. Statistically significant difference:*p<0.05.
Abbreviation: GC, gastric cancer.
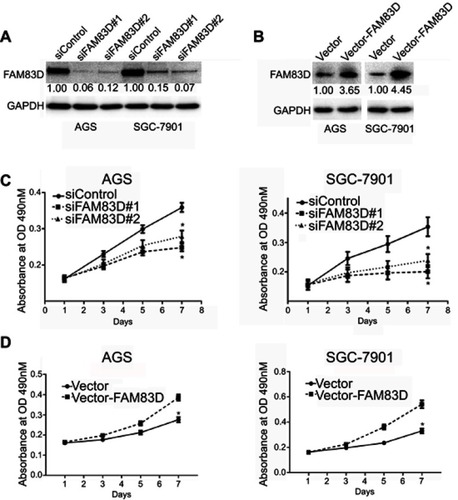
Figure 4 FAM83D promotes the clonogenicity of GC cells. (A) Colony formation assays of AGS and SGC-7901 cells transfected with negative control and FAM83D-targeted siRNAs. Left panel: representative image; right panel: quantification of the colony numbers. (B) Colony formation assays of control and FAM83D overexpressed GC cells. Left panel: representative image; right panel: quantification of the colony numbers. Statistically significant difference: p<0.05. ***p<0.001.
Abbreviation: GC, gastric cancer.
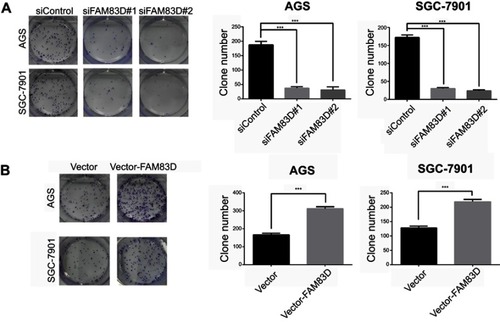
Figure 5 Knockout of FAM83D inhibits migration and invasion in vitro. (A) The migration assay using AGS and SGC-7901 transfected with FAM83D siRNA or control. (B) The invasion assay using AGS and SGC-7901 transfected with FAM83D siRNA or control. Left panel: representative image; Right panel: quantification of the colony numbers. Statistical method: independent t-test. Significant difference: p<0.05. ***p<0.001.
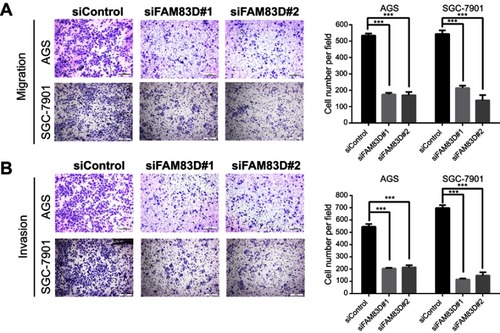
Figure 6 Overexpression of FAM83D facilitates migration and invasion in vitro. (A) The migration assay using AGS and SGC-7901 transfected with FAM83D or vector. (B) The invasion assay using AGS and SGC-7901 transfected with FAM83D or vector. Left panel: representative image; Right panel: quantification of the colony numbers. Statistical method: independent t-test. Significant difference: p<0.05. ***p<0.001.
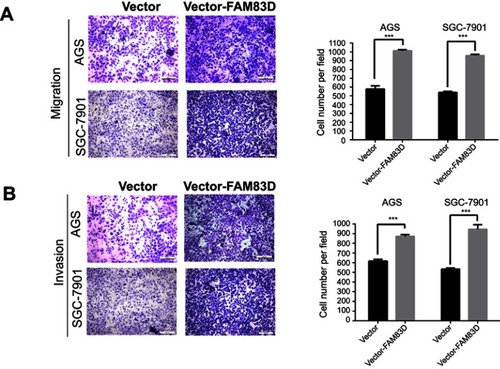
Figure 7 Knockout of FAM83D inhibits progression of cell cycle in GC cells. (A) Representative images of cell cycle analysis by flow cytometry in AGS cells after FAM83D depletion. (B) Representative images of cell cycle analysis by flow cytometry in SGC-7901 cells after FAM83D depletion. Every test was repeated independently three times. Statistically significant difference: p<0.05.***p<0.001.
Abbreviation: GC, gastric cancer.
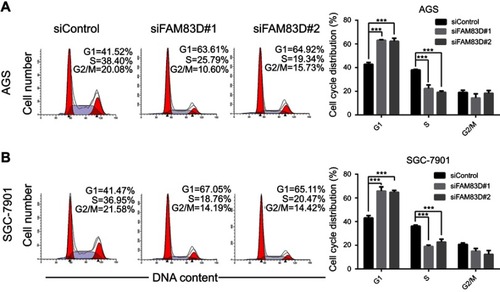
Figure 8 Overexpression of FAM83D accelerates progression of cell cycle in GC cells. (A) Representative images of cell cycle analysis by flow cytometry in AGS cells after FAM83D overexpression. (B) Representative images of cell cycle analysis by flow cytometry in SGC-7901 cells after FAM83D overexpression. Every test was repeated independently three times. Statistically significant difference: p<0.05. ***p<0.001.
Abbreviation: GC, gastric cancer.
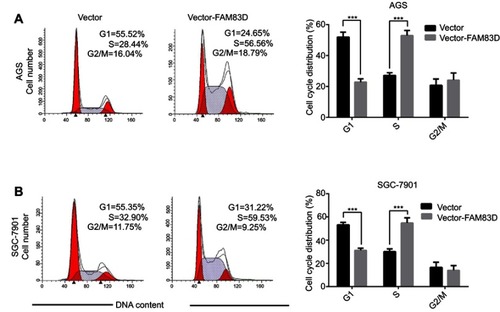
Figure 9 FAM83D activates Wnt/β-catenin signaling. Western blotting analysis of expression of p-GSK-3β, β-catenin, cyclin D1 and c-Myc in AGS and SGC-7901 cells after FAM83D depletion. (B) Western blotting analysis after FAM83D overexpression. (C) Western blotting analysis between siControl+LiCL (20mmol/L), siFAM83D#1+LiCL(20mmol/L) and siFAM83D#2+LiCL (20mmol/L) in AGS or SGC-7901 cell line.
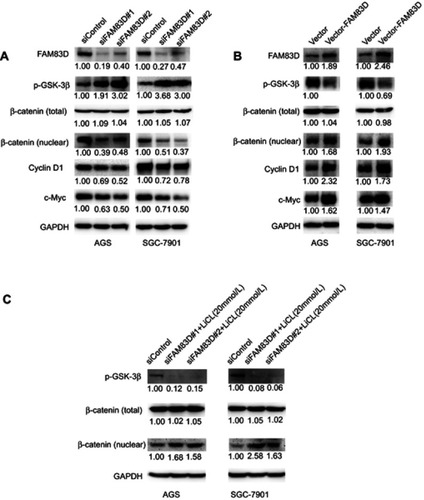
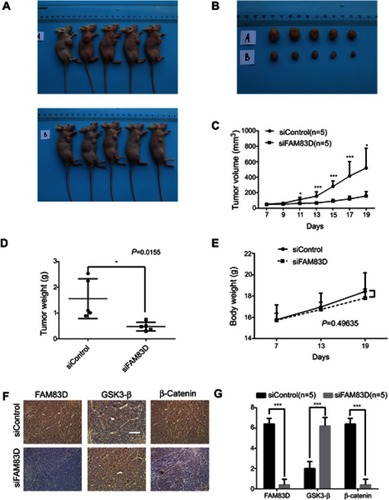
Figure 10 Knockdown of FAM83D inhibits tumour growth in nude mice. (A) Images of mice formed by AGS cells transfected with siControl or siFAM83D. (B) Images of tumors formed by AGS cells transfected with siControl or siFAM83D. (C) The growth curves of the tumours formed by AGS cells transfected with siControl or siFAM83D. The data are presented as the mean ± SD (N=5 mice per group). (D) Weight differences in tumours formed by AGS cells transfected with siControl or siFAM83D and injected in nude mice. The data are presented as the mean ± SD (N=5 mice per group). (E) Time course of body weight changes of two different groups. (F) The histological examination of FAM83D, GSK-3β and β-Catenin expressions the tumours formed by AGS cells transfected with siControl or siFAM83D. (G) Expression of FAM83D, GSK-3βandβ-Catenin was assessed by immunohistochemistry in tumors formed by AGS cells transfected with siControl or siFAM83D. Statistically significant difference: *p<0.05.***p<0.001.