
Figures & data
Figure 1 Identification of circ-ITGA7 as a low-expression biomarker in colorectal cancer (CRC) cells. (A) The cluster heat map shows the differentially expressed circRNAs in three CRC patients with tumor (T) and adjacent normal (N) tissue samples. The red color indicates high expression, whereas the blue color indicates low expression. (B) The levels of circ-ITGA were detected by qRT-PCR in CRC cells. (C) Schematic illustration of circ-ITGA7 produced from ITGA7. Outward-facing primers (F/R) were designed targeting a circRNA to examine its expression. (D) The levels of circ-ITGA7 were detected in CRC patients in tumor and adjacent normal colorectal tissues (ANCRT) (n=20). The data are expressed as means ± SEM of three independent experiments. **p<0.01, ***p<0.001.
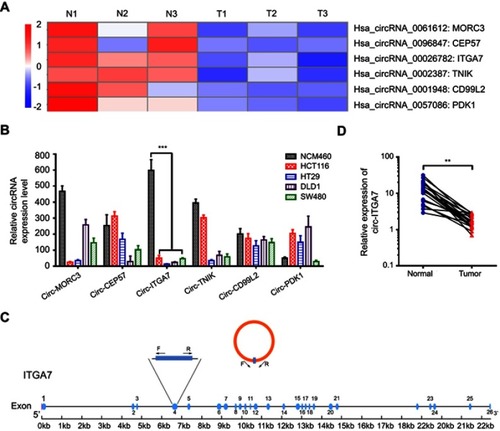
Figure 2 Circ-ITGA7 inhibits the proliferation of colorectal cancer (CRC) cells in vitro. (A) mRNA levels of circ-ITGA7 was determined by RT-PCR and qRT-PCR. RT-PCR showing product from vector- and circ-ITGA7-transfected cells. (B, C) Cell proliferation was evaluated by colony formation assays and CCK-8 assays using circ-ITGA7-overexpressing cells (HCT116 and SW480) and empty vector controls. (D) Circ-ITGA7 promotes CRC apoptosis, as assessed by flow cytometric analysis using Annexin V/propidium double staining for 4 days in serum-free culture. (E) Circ-ITGA7 stops CRC cells proliferation at G1 stage. (F, G) Circ-ITGA7 reduces the expression level of cyclin D1. The data are expressed as means ± SEM of three independent experiments. **p<0.01; ***p<0.001.
Abbreviations: NS, not significant; OE, over expressed.
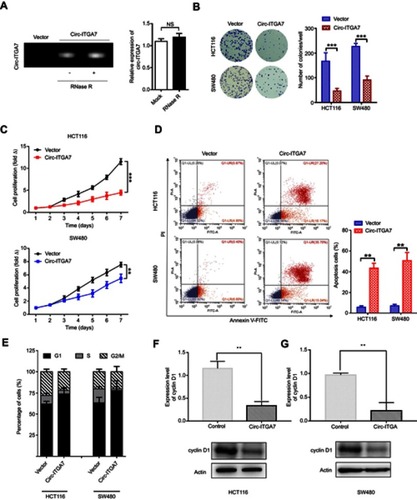
Figure 3 Circ-ITGA7 serves as a miRNA sponge to regulate ASXL1 expression. (A) Schematic flowchart shows the pipelines for identifying miRNA targets of circ-ITGA7 and target gene analyses. (B) qRT-PCR analysis of the expression of three candidate genes in HCT116 and SW480 cells with circ-ITGA7 overexpression. (C) ASXL1 protein levels in HCT116 and SW480 cells with circ-ITGA7 overexpression. (D) Correlation analysis of circ-ITGA7 and ASXL1 mRNA expression in adjacent normal colorectal tissues (ANCRT) (n=20). (E, F) Representative images and quantification results of the cell proliferation in circ-ITGA7-overexpressing HCT116 and SW480 cells, which were transfected with ASXL1 siRNAs or their corresponding controls. Data are expressed as means ± SEM of three independent experiments. *P<0.05; **p<0.01; ***p<0.001.
Abbreviations: NS, not significant; NC, negative control; Ctrl, control group.
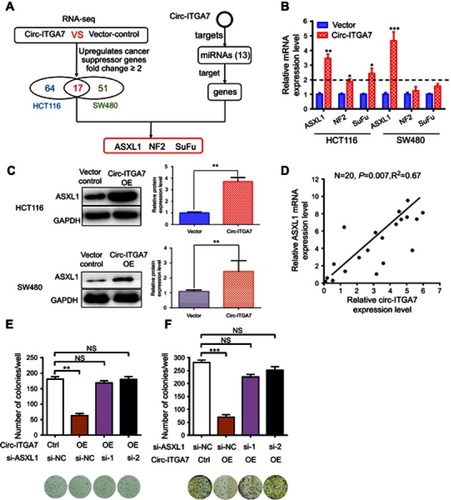
Figure 4 MiR-3187-3p mediates circ-ITGA7-dependent ASXL1 expression and cell proliferation. (A) Schematic graph illustrating potential binding sites between miR-3187-3p and circ-ITGA7 or the 5ʹ-UTR regions of ASXL1. (B) Luciferase reporter assays were performed to detect the luciferase activity of wild type Luc-ASXL1-5ʹUTR or Luc-ASXL1-5ʹUTR mutants in HCT116 cells. (C) qRT-PCR analysis of circ-ITGA7/miR-3187-3p and ASXL1 mRNA levels in HCT116 cells transfected with the Circ-ITGA7 overexpression plasmid and miR-3187-3p mimic/inhibitor. (D) Western blotting was used to detect the ASXL1 protein level in HCT116 and SW480 cells. (E) Representative images and quantification results of the cell proliferation in circ-ITGA7-overexpressing HCT116 and SW480 cells transfected with the miR-3187-3p mimic or their corresponding controls. Data are expressed as means ± SEM of three independent experiments. *p<0.05; **p<0.01; ***p<0.001.
Abbreviations: NC, negative control; Ctrl, control group; OE, over expressed; WT, wild type; Mut, mutant type.
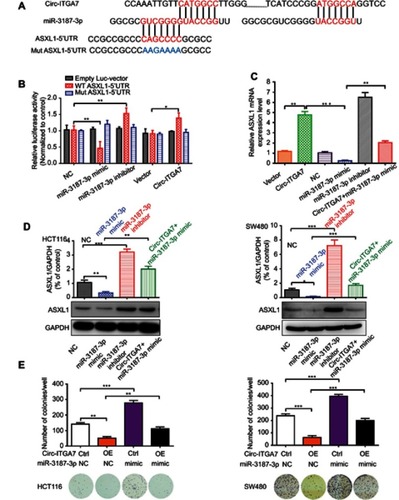
Table S1 Characteristics of patients
Data Availability
The datasets used and/or analyzed during the current study are available from the corresponding author on reasonable request.