
Figures & data
Figure 1 Gene expression profiling analysis in PTCL. (A) Hierarchical clustering of gene expression profiles generated from five AITL samples and five normal T-cell samples. DEGs were selected with a fold change >2 and P-value < 0.001 among the mRNA expression profiling; (B) Ten samples are clustered according to the expression of 17 differentially expressed genes; (C and D) Top 30 enrichment of GO terms and KEGG pathways for differentially expressed genes; (E) The PPI network of 17 DEGs was constructed. Red cycle nodes represent genes, and the edges represent interaction between genes, the width of edges represents the combined score.
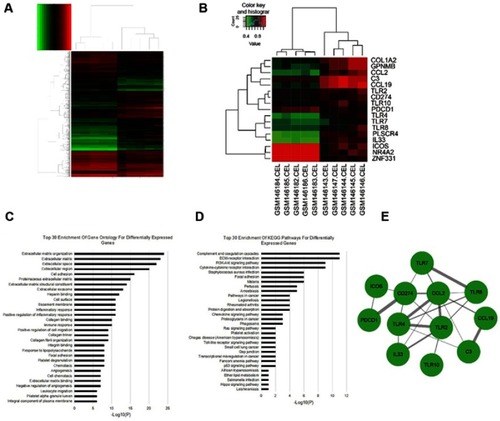
Table 1 Correlation between TLR4 and PD-L1 expression and various clinicopathological features
Figure 2 Representative images of TLR4 and PD-L1 immunohistochemical staining of PTCL tissues. (A) Negative and (B) positive TLR4 expression in PTCL tissues; (C) Negative and (D) positive PD-L1 expression in PTCL tissues.
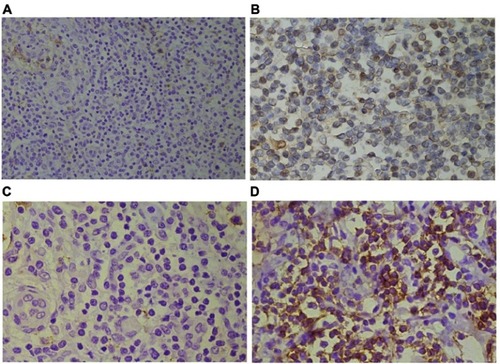
Table 2 Correlation between TLR4 expression and PD-L1 expression
Figure 3 Kaplan Meier analysis for PFS and OS based on TLR4 and PD-L1 expression in PTCL patients. (A) Kaplan-Meier analysis for PFS based on TLR4 expression in patients with PTCL (log-rank test, P=0.021); (B) Kaplan-Meier analysis for OS based on TLR4 expression in patients with PTCL (log-rank test, P=0.016); (C) Kaplan-Meier analysis for PFS based on PD-L1 expression in patients with PTCL (log-rank test, P=0.002); (D) Kaplan-Meier analysis for OS based on PD-L1 expression in patients with PTCL (log-rank test, P<0.001).
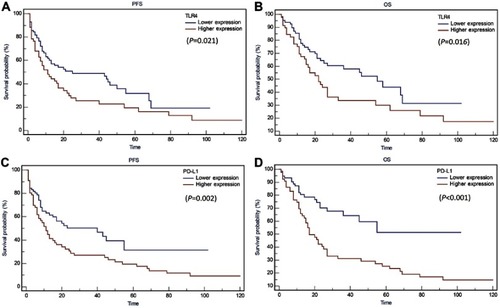
Figure 4 Kaplan Meier analysis for PFS and OS based on TLR4 and PD-L1 expression in AITL patients. (A) Kaplan-Meier analysis for PFS based on TLR4 expression in patients with AITL (log-rank test, P=0.208); (B) Kaplan-Meier analysis for OS based on TLR4 expression in patients with AITL (log-rank test, P=0.027); (C) Kaplan-Meier analysis for PFS based on PD-L1 expression in patients with AITL (log-rank test, P=0.091); (D) Kaplan-Meier analysis for OS based on PD-L1 expression in patients with AITL (log-rank test, P=0.021).
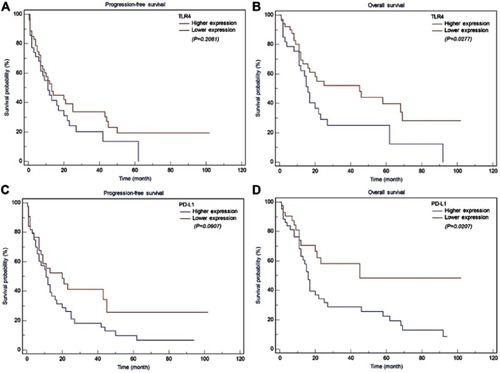
Table 3 Prognostic factors affecting the progression free survival of patients with PTCLs
Table 4 Prognostic factors affecting the overall survival of patients with PTCLs