Figures & data
Table 1 Demographic and clinical characteristics of sample (N=52)
Figure 1 Changes in fatigue score between patients undergoing radiation therapy (N=35) and active surveillance (N=17). Fatigue was measured by the revised Piper Fatigue Scale (rPFS).
Notes: X-axis indicates time points: day 0=prior XRT; day 21=day 21 of XRT, midpoint; day 42=completion of XRT, endpoint. Y-axis represents revised Piper Fatigue score. Fatigue score was significantly increased at day 21 (t=2.06, P=0.03) and day 42 (t=2.71, P=0.002) in patients with XRT; additionally, there was a significant difference in fatigue scores between XRT and AS groups over time. aRefers to a significant difference compared to day 0 time point of the same group. bRefers to a significant difference compared to the AS group at the same time point. *P<0.05; **P<0.01. a*b*Represents a significant change in fatigue score (P<0.05) in patients receiving XRT and a significant difference in fatigue score (P<0.05) between XRT and AS groups. a**b*Represents a significant change in fatigue score (P<0.01) in patients receiving XRT, and a significant difference in fatigue score (P<0.05) between XRT and AS groups.
Abbreviations: XRT, external beam radiation therapy; AS, active surveillance.
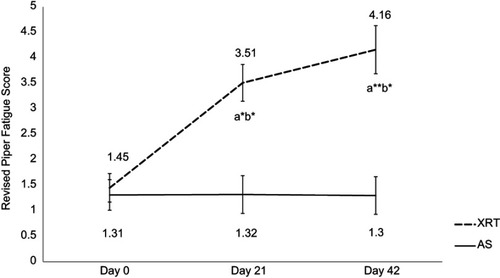
Table 2 Integrated mitochondrial function in peripheral blood mononuclear cells of patients with prostate cancer
Figure 2 Changes in mitochondrial oxidative phosphorylation (OXPHOS, complex I+II linked, uncoupled complex I+II-linked, coupled complex III, and uncoupled complex III) over time between patients with radiation therapy (N=33) and active surveillance (N=15). 26pp
Notes: X-axis indicates time points and Y-axis represents cell respiration rate (pmol O2/sec/106 cells). A: OXPHOS-complex I+II linked oxidation was measured as ADP-stimulated respiration with malate, pyruvate, glutamate, and succinate as substrates, reflecting the convergence of complex I and II. B: Uncoupled complex I+II was obtained with addition of the uncoupler, FCCP representing maximal oxidative capacity. C: Coupled complex III rate was measured as the ADP-stimulated respiration with DHQ, a substrate for complex III. D: Uncoupled complex III was determined after the addition of the uncoupler, FCCP. aRefers to a significant difference compared to day 0 time point of the same group. bRefers to a significant difference compared to the AS group at the same time point. *P<0.05; **P<0.01. a*b*Represents a significant change in fatigue score (P<0.05) in patients receiving XRT and a significant difference in fatigue score (P<0.05) between XRT and AS groups.
Abbreviations: OXPHOS, oxidative phosphorylation; XRT, external beam radiation therapy; AS, active surveillance; FCCP, carbonylcyanide-p-trifluoromethoxyphenylhydrazone; DHQ, duroquinol.
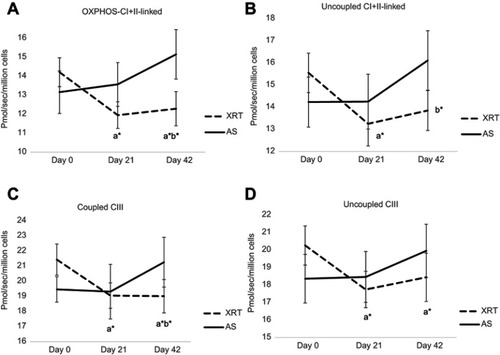
Table 3 Electron-transport chain enzymatic activity in peripheral blood mononuclear cells
Figure 3 Changes in electron-transport chain complex enzymatic activity in mononuclear cells in patients with radiation therapy (N=33).
Notes: CII was measured as TTFA-sensitive DCPIP reductase; total complex II determined with coenzyme Q1 added (CII+Q1); CIII, measured as antimycin A-sensitive decylubiquinol cytochrome c reductase; CS is mitochondrial marker; SDH was used to measure the first 2 subunits of complex II and served as a membrane-bonded mitochondrial marker enzyme; LDH as a cytoplasm marker. *P<0.05.
Abbreviations: NADH, nicotinamide adenine dinucleotide; NCR, rotenone-sensitive NADH cytochrome c reductase; SCR, antimycin A-sensitive succinate cytochrome c reductase; CII, complex II activity; TTFA, thenoyltrifluoroacetone; DCPIP, dichlorophenol-indophenol; CII+Q1, complex II with coenzyme Q1; CIII, complex III activity, measured as antimycin A-sensitive decylubiquinol cytochrome c reductase; CIV, complex IV (cytochrome c oxidase) activity; CS, citrate synthase, mitochondrial marker; SDH, succinate dehydrogenase; LDH, lactate dehydrogenase.
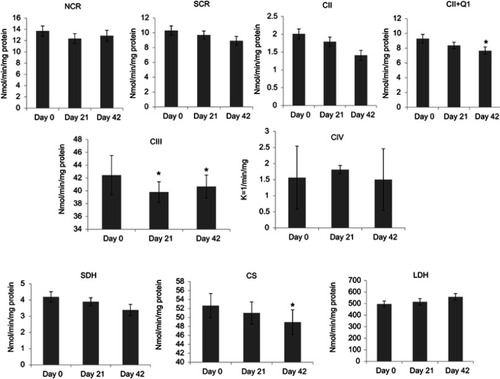
Figure 4 Changes in ETC complex III between patients with radiation therapy (N=33) and active surveillance (N=15).
Notes:Y-axis represents cell enzyme activity (nmol/min/mg protein). ETC CIII enzymatic activity, which was measured as antimycin A-sensitive decylubiquinol cytochrome c reductase. ETC CIII activity was significantly decreased at day 21 (t=−2.64, P=0.044) and day 42 (t=−1.78, P=0.047) in patients with XRT; additionally, there was a significant difference in CIII activity between XRT and AS groups over time. aRefers to a significant difference compared to day 0 time point of the same group. bRefers to a significant difference compared to the AS group at the same time point. *P<0.05.
Abbreviations: ETC, electron transport chain; CIII, complex III activity; XRT, external beam radiation; AS, active surveillance.
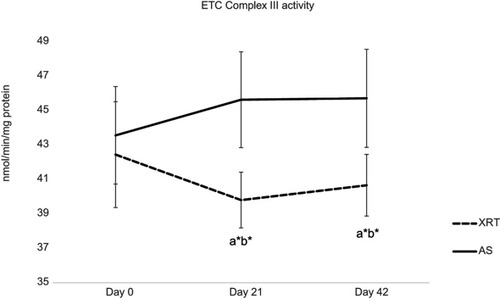
Figure 5 Differences in gene expression of BCS1L at day 21 and day 42 between patients undergoing radiation therapy (XRT, N=33) and active surveillance (AS, N=13).
Notes: Left figure indicates the expression of BCS1L gene. Y-axis represents expression values assayed by monitoring in real-time polymerase chain reaction calculated as fold change. The expression of BCS1L was significant different between patients undergoing XRT and AS (P<0.05). Furthermore, BCS1L was significantly downregulated at day 21 (fold change=−1.76, P=0.03) and day 42 (fold change=−1.87, P=0.02) in XRT patients compared to day 0. aRefers to a significant difference compared to day 0 time point of the same group. bRefers to a significant difference compared to the AS group at the same time point. *P<0.05.
Abbreviations: BCS1L, BC1 (ubiquinol-cytochrome c reductase) synthesis-like; XRT, external beam radiation therapy; AS, active surveillance.
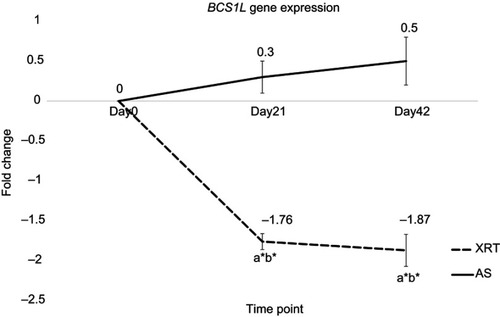
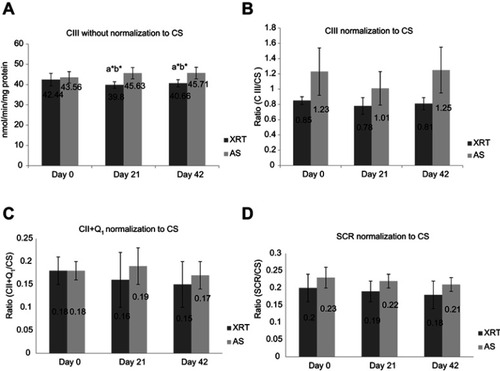
Figure 6 ETC complex III activity without and with normalization of citrate synthase (A and B) and CII+Q1 (C) and SCR (D) with normalization of citrate synthase between patients undergoing XRT (N=35) and AS (N=15). (A) CIII without normalization of CS; (B) CIII with normalization of CS; (C) CII+Q1 with normalization of CS; (D) SCR with normalization of CS.
Notes:aSignificant difference compared to day 0 time point of the same group. bSignificant difference compared to the AS group at the same time point. *P<0.05. CIII, measured as antimycin A-sensitive decylubiquinol cytochrome c reductase; CII, measured as the TTFA-sensitive succinate-2,6 DCPIP reductase and total CII determined with coenzyme Q added (CII+Q1); SCR, antimycin A-sensitive succinate cytochrome c reductase was used to measure the linked activity of CII and CIII.
Abbreviations: CIII, complex III activity; CS, citrate synthase; CII, complex II activity; TTFA, thenoyltrifluoroacetone; DCPIP, dichlorophenol-indophenol; CII+Q1, complex II with coenzyme Q1; SCR, succinate cytochrome c reductase; XRT, patients undergoing radiation therapy; AS, patients undergoing active surveillance.