
Figures & data
Table 1 Distributions of selected characteristics among cases and controls
Table 2 The risk of alcohol consumption in hypopharyngeal cancer
Figure 1 Comparison of formaldehyde concentration in traditional liquor and commercial liquor samples. Formaldehyde concentration in traditional liquor samples (n=38) was higher than that in commercial liquor samples (n=33, p=0.045). p-value was tested by Wilcoxon rank sum test. Circles represent outlier value, asterisks represent extreme value.
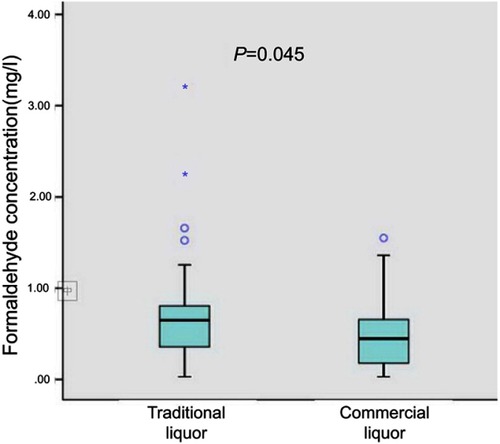
Table 3 The risk of tobacco consumption in hypopharyngeal cancer
Table 4 Alcohol consumption and tobacco smoking interaction parameters and attributable risks for hypopharyngeal cancer by age
Table 5 Betel quid consumption and oral health with the risk of hypopharyngeal cancer
Table S1 Comparison of traditional and commercial liquor consumptive volume